FiboPiv_v2_002
Download script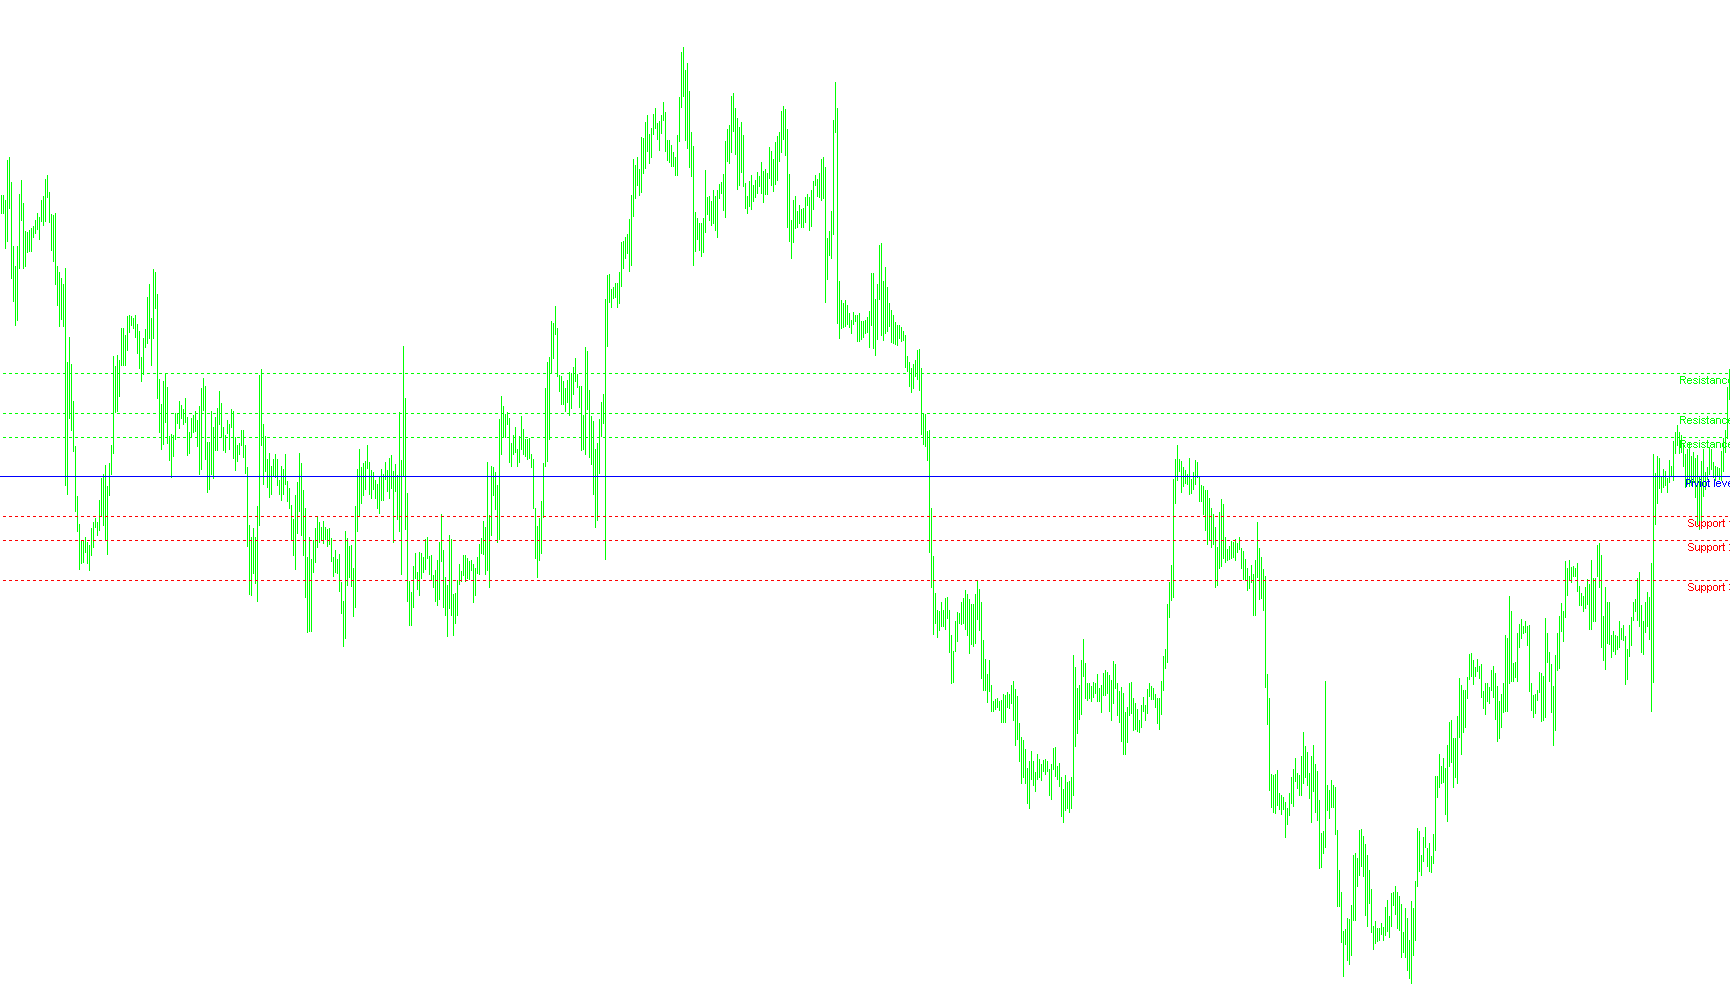
This tool is designed to automate the calculation and visual plotting of Pivot Points on your trading charts. It simplifies the process of identifying key price levels—specifically Support and Resistance zones—which traders use to determine potential areas where a market price might stall, reverse, or break through.
Core Logic & Methodology
1. Data Gathering (Smart Historical Lookup) The script begins by analyzing the previous day's trading data. It specifically looks for three critical price points: the High, the Low, and the Close.
One of its intelligent features is how it handles weekends. If you open your charts on a Monday, the script recognizes that there was no trading on Sunday. Instead of pulling irrelevant data, it automatically "looks back" to find the most recent Friday's trading data to ensure the calculations remain accurate for the current week.
2. The Calculation Engine Once the script identifies the previous day's High, Low, and Close, it performs a series of mathematical operations to generate seven distinct levels:
- The Pivot Point: This is the central baseline, calculated as the average of the previous day's High, Low, and Close.
- Resistance Levels (R1, R2, R3): These represent potential "ceilings" where selling pressure might increase. The script calculates these by adding specific proportions of the daily price range to the central Pivot Point.
- Support Levels (S1, S2, S3): These represent potential "floors" where buying interest might emerge. These are calculated by subtracting those same proportions from the central Pivot Point.
The script utilizes specific mathematical ratios (such as 0.382 and 0.618) to distribute these levels across the price action, providing a balanced view of where structural shifts might occur.
3. Visual Presentation Rather than just providing numbers in a list, the script automatically draws the following on your chart:
- Horizontal Lines: Clear visual markers for all three Resistance levels, the central Pivot Point, and all three Support levels.
- Color Coding: The script distinguishes between types of levels using colors—Resistance lines are typically highlighted in green/lime, Support lines in red, and the main Pivot level in blue.
- Dynamic Labels: It places text labels next to each line (e.g., "Support 1," "Resistance 3") so you can instantly identify what each line represents without having to guess.
- Real-Time Updates: The script is designed to refresh these lines as the market moves, ensuring that your levels are always based on the most current historical data available.
Summary of Use
Essentially, this tool eliminates the manual math required to plot technical levels. It automatically scans the previous day's price action, calculates the structural boundaries for the current session, and paints them onto your screen, allowing you to focus on making trading decisions rather than performing calculations.
//+------------------------------------------------------------------+
//|                                                   FiboPiv_v1.mq4 |
//|                                                          Kalenzo |
//|                                      bartlomiej.gorski@gmail.com |
//+------------------------------------------------------------------+
#property copyright "Kalenzo"
#property link      "bartlomiej.gorski@gmail.com"

#property indicator_chart_window
//+------------------------------------------------------------------+
//| Custom indicator initialization function                         |
//+------------------------------------------------------------------+
int init()
  {
//---- indicators
//----
   return(0);
  }
//+------------------------------------------------------------------+
//| Custom indicator deinitialization function                       |
//+------------------------------------------------------------------+
int deinit()
  {
//----
   ObjectDelete("S1");
   ObjectDelete("S2");
   ObjectDelete("S3");
   ObjectDelete("R1");
   ObjectDelete("R2");
   ObjectDelete("R3");
   ObjectDelete("PIVIOT");
   ObjectDelete("Support 1");
   ObjectDelete("Support 2");
   ObjectDelete("Support 3");
   ObjectDelete("Piviot level");
   ObjectDelete("Resistance 1");
   ObjectDelete("Resistance 2");
   ObjectDelete("Resistance 3");
   Comment(" ");
//----
   return(0);
  }
//+------------------------------------------------------------------+
//| Custom indicator iteration function                              |
//+------------------------------------------------------------------+
int start()
  {

//----
double rates[1][6],yesterday_close,yesterday_high,yesterday_low;
ArrayCopyRates(rates, Symbol(), PERIOD_D1);

if(DayOfWeek() == 1)
{
   if(TimeDayOfWeek(iTime(Symbol(),PERIOD_D1,1)) == 5)
   {
       yesterday_close = rates[1][4];
       yesterday_high = rates[1][3];
       yesterday_low = rates[1][2];
   }
   else
   {
      for(int d = 5;d>=0;d--)
      {
         if(TimeDayOfWeek(iTime(Symbol(),PERIOD_D1,d)) == 5)
         {
             yesterday_close = rates[d][4];
             yesterday_high = rates[d][3];
             yesterday_low = rates[d][2];
         }

      }
   }
}
else
{
    yesterday_close = rates[1][4];
    yesterday_high = rates[1][3];
    yesterday_low = rates[1][2];
}


//---- Calculate Pivots

Comment("\nYesterday quotations:\nH ",yesterday_high,"\nL ",yesterday_low, "\nC ",yesterday_close);
double R = yesterday_high - yesterday_low;//range
double p = (yesterday_high + yesterday_low + yesterday_close)/3;// Standard Pivot
double r3 = p + (R * 1.000);
double r2 = p + (R * 0.618);
double r1 = p + (R * 0.382);
double s1 = p - (R * 0.382);
double s2 = p - (R * 0.618);
double s3 = p - (R * 1.000);

drawLine(r3,"R3", Lime,0);
drawLabel("Resistance 3",r3,Lime);
drawLine(r2,"R2", Lime,0);
drawLabel("Resistance 2",r2,Lime);
drawLine(r1,"R1", Lime,0);
drawLabel("Resistance 1",r1,Lime);

drawLine(p,"PIVIOT",Blue,1);
drawLabel("Piviot level",p,Blue);

drawLine(s1,"S1",Red,0);
drawLabel("Support 1",s1,Red);
drawLine(s2,"S2",Red,0);
drawLabel("Support 2",s2,Red);
drawLine(s3,"S3",Red,0);
drawLabel("Support 3",s3,Red);


//----
   return(0);
  }
//+------------------------------------------------------------------+
void drawLabel(string name,double lvl,color Color)
{
    if(ObjectFind(name) != 0)
    {
        ObjectCreate(name, OBJ_TEXT, 0, Time[10], lvl);
        ObjectSetText(name, name, 8, "Arial", EMPTY);
        ObjectSet(name, OBJPROP_COLOR, Color);
    }
    else
    {
        ObjectMove(name, 0, Time[10], lvl);
    }
}


void drawLine(double lvl,string name, color Col,int type)
{
         if(ObjectFind(name) != 0)
         {
            ObjectCreate(name, OBJ_HLINE, 0, Time[0], lvl,Time[0],lvl);

            if(type == 1)
            ObjectSet(name, OBJPROP_STYLE, STYLE_SOLID);
            else
            ObjectSet(name, OBJPROP_STYLE, STYLE_DOT);

            ObjectSet(name, OBJPROP_COLOR, Col);
            ObjectSet(name,OBJPROP_WIDTH,1);

         }
         else
         {
            ObjectDelete(name);
            ObjectCreate(name, OBJ_HLINE, 0, Time[0], lvl,Time[0],lvl);

            if(type == 1)
            ObjectSet(name, OBJPROP_STYLE, STYLE_SOLID);
            else
            ObjectSet(name, OBJPROP_STYLE, STYLE_DOT);

            ObjectSet(name, OBJPROP_COLOR, Col);
            ObjectSet(name,OBJPROP_WIDTH,1);

         }
}
Comments