fibopiv monthly
Download script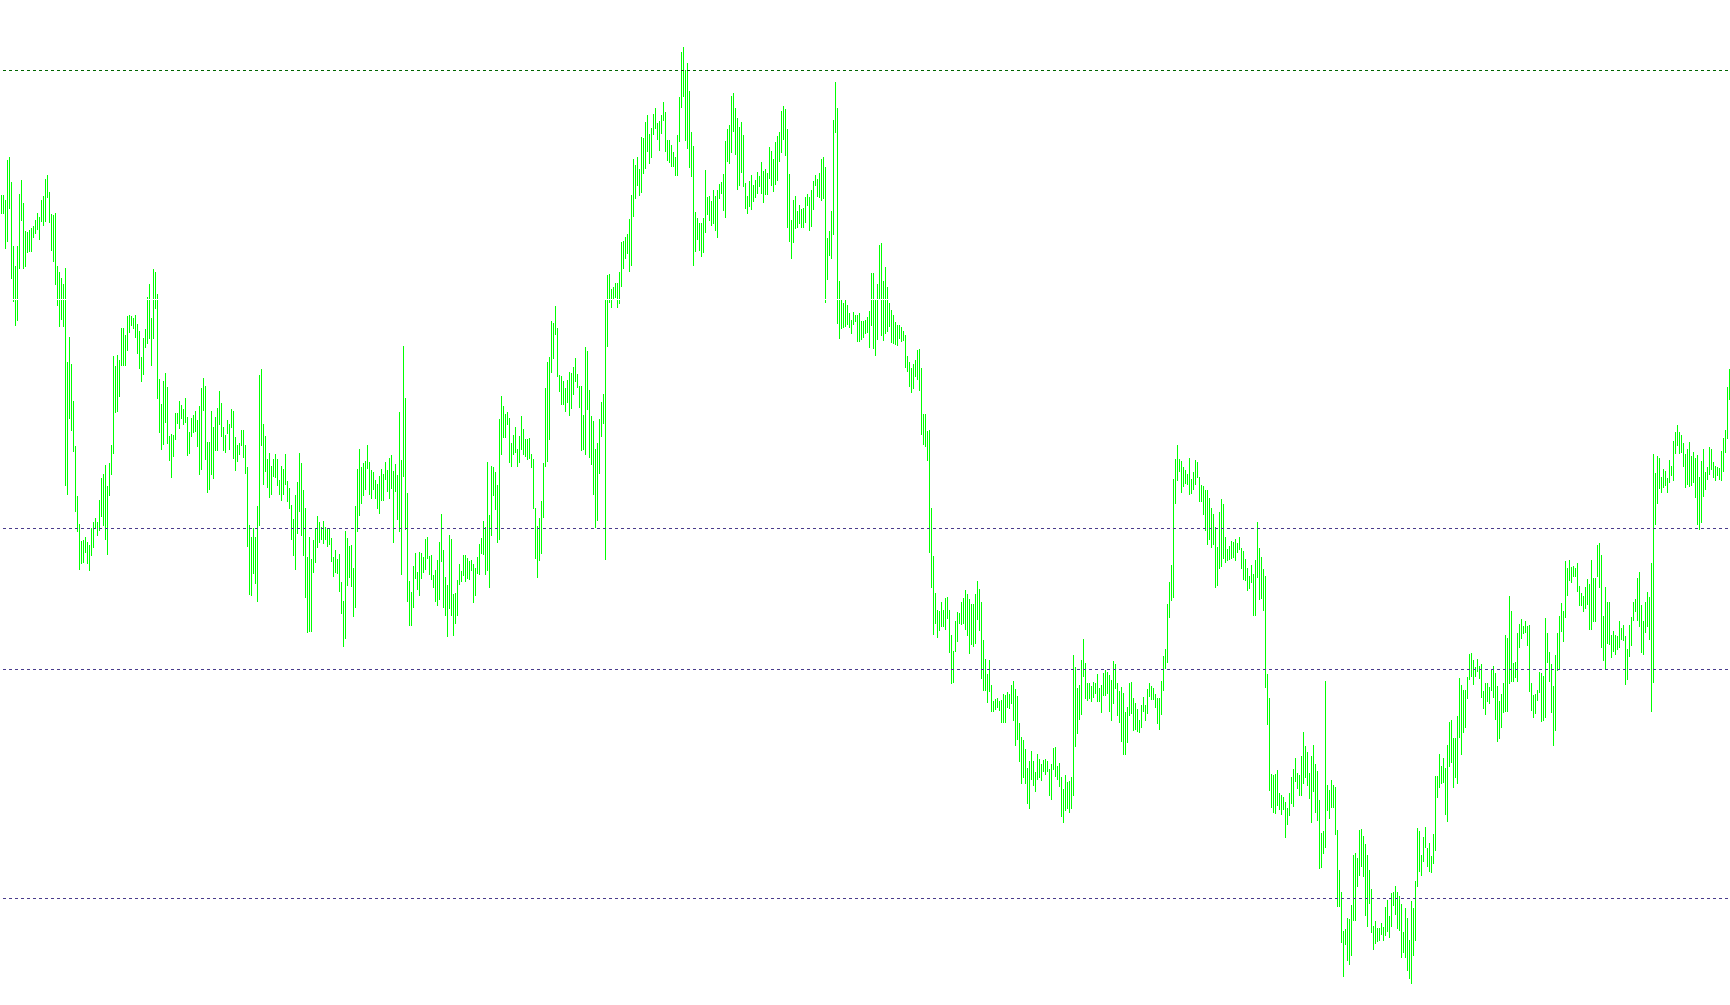
This tool is designed to provide traders with a clear visual roadmap of key price levels based on monthly market behavior. By analyzing the high, low, and closing prices of previous months, it automatically identifies "Pivot" points—significant psychological levels where the price may face resistance or find support.
Core Logic & Functionality
1. Data Gathering and Smart Identification The script begins by scanning historical data to find the most relevant monthly statistics. It specifically looks for the highest price reached (High), the lowest price reached (Low), and the final closing price (Close) of the previous month. To ensure accuracy, the logic includes a smart check for weekends; if the market was closed on a Friday, it intelligently scans backward to find the last valid trading day to pull the correct data.
2. Calculation Methodology Once the three key prices are identified, the script performs the following calculations:
- The Range: It determines the total distance between the monthly high and low.
- The Monthly Pivot: It calculates a central equilibrium point by averaging the high, low, and closing prices.
- Support and Resistance Levels: Using the "Range" and specific mathematical ratios (including the Golden Ratio of 0.618), it projects three levels of resistance above the pivot and three levels of support below it.
3. Visual Representation on Chart The tool translates these complex calculations into an easy-to-read visual interface:
- Resistance Zones: These are plotted as green dotted lines. They represent areas where price may struggle to move higher, acting as potential "ceilings."
- Support Zones: These are plotted as dark blue dotted lines. They represent areas where price may find a floor and bounce back up.
- The Pivot Point: This is displayed as a prominent solid white line, representing the main balance point for the month.
User Experience
For a trader, this means the chart is automatically populated with objective boundaries. Instead of guessing where the market might turn, you can see clearly defined zones based on historical monthly trends. The script handles all the math in the background, updating these levels so you can focus on identifying entry and exit opportunities at these key structural landmarks.
//+------------------------------------------------------------------+
//|                                              fibopiv monthly.mq4 |
//|                      Copyright © 2007, MetaQuotes Software Corp. |
//|                                        http://www.metaquotes.net |
//+------------------------------------------------------------------+
#property copyright "Copyright © 2007, MetaQuotes Software Corp."
#property link      "http://www.metaquotes.net"

#property indicator_chart_window
//+------------------------------------------------------------------+
//| Custom indicator initialization function                         |
//+------------------------------------------------------------------+
int init()
  {
//---- indicators
//----
   return(0);
  }
//+------------------------------------------------------------------+
//| Custom indicator deinitialization function                       |
//+------------------------------------------------------------------+
int deinit()
  {
//----
   ObjectDelete("MS1");
   ObjectDelete("MS2");
   ObjectDelete("MS3");
   ObjectDelete("MR1");
   ObjectDelete("MR2");
   ObjectDelete("MR3");
   ObjectDelete("MONTHLY PIVOT");
   ObjectDelete("Monthly Support 1");
   ObjectDelete("Monthly 2");
   ObjectDelete("Monthly 3");
   ObjectDelete("Monthly Pivot level");
   ObjectDelete("Monthly Resistance 1");
   ObjectDelete("Monthly Resistance 2");
   ObjectDelete("Monthly Resistance 3");
   Comment(" ");
//----
   return(0);
  }
//+------------------------------------------------------------------+
//| Custom indicator iteration function                              |
//+------------------------------------------------------------------+
int start()
  {

//----
double rates[1][6],monthly_close,monthly_high,monthly_low;
ArrayCopyRates(rates, Symbol(), PERIOD_MN1);

if(DayOfWeek() == 1)
{
   if(TimeDayOfWeek(iTime(Symbol(),PERIOD_MN1,1)) == 5)
   {
       monthly_close = rates[1][4];
       monthly_high = rates[1][3];
       monthly_low = rates[1][2];
   }
   else
   {
      for(int d = 5;d>=0;d--)
      {
         if(TimeDayOfWeek(iTime(Symbol(),PERIOD_MN1,d)) == 5)
         {
             monthly_close = rates[d][4];
             monthly_high = rates[d][3];
             monthly_low = rates[d][2];
         }

      }
   }
}
else
{
    monthly_close = rates[1][4];
    monthly_high = rates[1][3];
    monthly_low = rates[1][2];
}


//---- Calculate Pivots

Comment("\nMonthly quotations:\nH ",monthly_high,"\nL ",monthly_low, "\nC ",monthly_close);
double R = monthly_high - monthly_low;//range
double mp = (monthly_high + monthly_low + monthly_close)/3;// Standard Pivot
double mr3 = mp + (R * 1.000);
double mr2 = mp + (R * 0.618);
double mr1 = mp + (R * 0.382);
double ms1 = mp - (R * 0.382);
double ms2 = mp - (R * 0.618);
double ms3 = mp - (R * 1.000);

drawLine(mr3,"MR3", DarkGreen,0);
drawLabel("Monthly Resistance 3",mr3,White);
drawLine(mr2,"MR2", DarkGreen,0);
drawLabel("Monthly Resistance 2",mr2,White);
drawLine(mr1,"MR1", DarkGreen,0);
drawLabel("Monthly Resistance 1",mr1,White);

drawLine(mp,"MONTHLY PIVOT",White,1);
drawLabel("Monthly Pivot ",mp,White);

drawLine(ms1,"MS1",DarkSlateBlue,0);
drawLabel("Monthly Support 1",ms1,White);
drawLine(ms2,"MS2",DarkSlateBlue,0);
drawLabel("Monthly Support 2",ms2,White);
drawLine(ms3,"MS3",DarkSlateBlue,0);
drawLabel("Monthly Support 3",ms3,White);


//----
   return(0);
  }
//+------------------------------------------------------------------+
void drawLabel(string name,double lvl,color Color)
{
    if(ObjectFind(name) != 0)
    {
        ObjectCreate(name, OBJ_TEXT, 0, Time[10], lvl);
        ObjectSetText(name, name, 8, "Lucida Handwriting", EMPTY);
        ObjectSet(name, OBJPROP_COLOR, Color);
    }
    else
    {
        ObjectMove(name, 0, Time[10], lvl);
    }
}


void drawLine(double lvl,string name, color Col,int type)
{
         if(ObjectFind(name) != 0)
         {
            ObjectCreate(name, OBJ_HLINE, 0, Time[0], lvl,Time[0],lvl);

            if(type == 1)
            ObjectSet(name, OBJPROP_STYLE, STYLE_SOLID);
            else
            ObjectSet(name, OBJPROP_STYLE, STYLE_DOT);

            ObjectSet(name, OBJPROP_COLOR, Col);
            ObjectSet(name,OBJPROP_WIDTH,1);

         }
         else
         {
            ObjectDelete(name);
            ObjectCreate(name, OBJ_HLINE, 0, Time[0], lvl,Time[0],lvl);

            if(type == 1)
            ObjectSet(name, OBJPROP_STYLE, STYLE_SOLID);
            else
            ObjectSet(name, OBJPROP_STYLE, STYLE_DOT);

            ObjectSet(name, OBJPROP_COLOR, Col);
            ObjectSet(name,OBJPROP_WIDTH,1);

         }
}
Comments