FiboPiv_v2_v3
Download script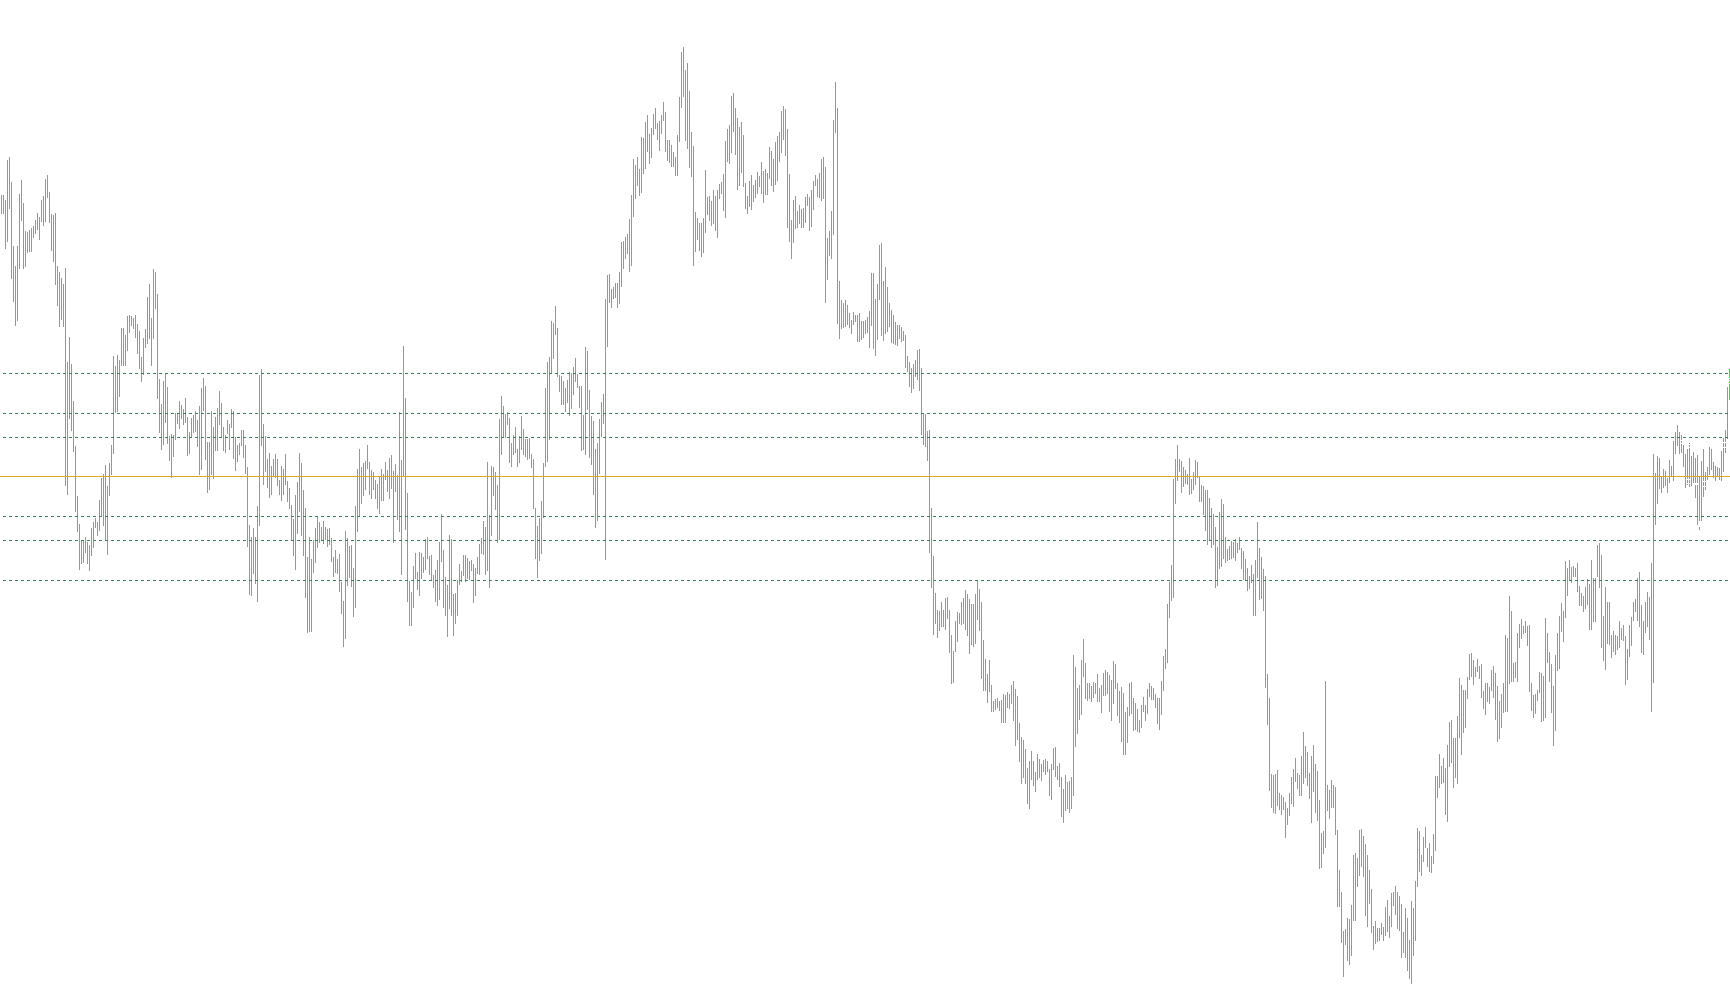
The FiboPiv_v1 script is an automated technical analysis tool designed to identify key price levels on a trading chart. It simplifies the process of determining potential support and resistance zones by calculating "Pivot Points" based on historical price data.
How the Logic Works
Data Gathering and Smart Handling The script begins by looking back at the previous day's market activity. To ensure accuracy, it includes specific logic to handle weekends. If the current market day is a Monday, the script intelligently searches for the most recent preceding Friday's data (high, low, and closing prices) to use as its baseline. For all other days, it simply pulls the data from the immediate previous trading session.
The Calculation Process Once the historical data is identified, the script performs a series of mathematical operations to project future price levels:
- Range Identification: It calculates the total distance between the previous day's high and low points.
- The Pivot Point: It determines the "central" price level by averaging the previous day's high, low, and closing prices.
- Fibonacci Integration: The script then uses specific Fibonacci ratios (notably 0.382, 0.618, and 1.000) multiplied by the daily range. It applies these to the central Pivot Point to create a symmetrical web of levels above and below the current price.
Visual Representation The script automatically translates these complex calculations into visual cues on your chart:
- Support Levels (S1, S2, S3): These are plotted below the pivot point, representing areas where price may find "bottom" support or struggle to fall further.
- Resistance Levels (R1, R2, R3): These are plotted above the pivot point, highlighting areas where the price might face selling pressure or difficulty breaking upward.
- The Pivot Level: This is highlighted as a central reference point for the day’s sentiment.
Key Features for the User
- Automated Updating: The script dynamically calculates these levels, ensuring they reflect the most recent market data without manual input.
- Clear Labeling: Every level is automatically labeled on the chart (e.g., "Support 1", "Resistance 2"), making it easy to read at a glance.
- Clean Interface: The tool includes a "cleanup" mechanism that ensures old, outdated objects are removed from the chart as new ones are created, keeping your workspace organized and clutter-free.
//+------------------------------------------------------------------+
//|                                                   FiboPiv_v1.mq4 |
//|                                                          Kalenzo |
//|                                      bartlomiej.gorski@gmail.com |
//+------------------------------------------------------------------+
#property copyright "Kalenzo"
#property link      "bartlomiej.gorski@gmail.com"

#property indicator_chart_window
//+------------------------------------------------------------------+
//| Custom indicator initialization function                         |
//+------------------------------------------------------------------+
int init()
  {
//---- indicators
//----
   return(0);
  }
//+------------------------------------------------------------------+
//| Custom indicator deinitialization function                       |
//+------------------------------------------------------------------+
int deinit()
  {
//----
   ObjectDelete("S1");
   ObjectDelete("S2");
   ObjectDelete("S3");
   ObjectDelete("R1");
   ObjectDelete("R2");
   ObjectDelete("R3");
   ObjectDelete("PIVIOT");
   ObjectDelete("Support 1");
   ObjectDelete("Support 2");
   ObjectDelete("Support 3");
   ObjectDelete("Piviot level");
   ObjectDelete("Resistance 1");
   ObjectDelete("Resistance 2");
   ObjectDelete("Resistance 3");
   Comment(" ");
//----
   return(0);
  }
//+------------------------------------------------------------------+
//| Custom indicator iteration function                              |
//+------------------------------------------------------------------+
int start()
  {

//----
double rates[1][6],yesterday_close,yesterday_high,yesterday_low;
ArrayCopyRates(rates, Symbol(), PERIOD_D1);

if(DayOfWeek() == 1)
{
   if(TimeDayOfWeek(iTime(Symbol(),PERIOD_D1,1)) == 5)
   {
       yesterday_close = rates[1][4];
       yesterday_high = rates[1][3];
       yesterday_low = rates[1][2];
   }
   else
   {
      for(int d = 5;d>=0;d--)
      {
         if(TimeDayOfWeek(iTime(Symbol(),PERIOD_D1,d)) == 5)
         {
             yesterday_close = rates[d][4];
             yesterday_high = rates[d][3];
             yesterday_low = rates[d][2];
         }

      }
   }
}
else
{
    yesterday_close = rates[1][4];
    yesterday_high = rates[1][3];
    yesterday_low = rates[1][2];
}


//---- Calculate Pivots

Comment("\nYesterday quotations:\nH ",yesterday_high,"\nL ",yesterday_low, "\nC ",yesterday_close);
double R = yesterday_high - yesterday_low;//range
double p = (yesterday_high + yesterday_low + yesterday_close)/3;// Standard Pivot
double r3 = p + (R * 1.000);
double r2 = p + (R * 0.618);
double r1 = p + (R * 0.382);
double s1 = p - (R * 0.382);
double s2 = p - (R * 0.618);
double s3 = p - (R * 1.000);

drawTrendline(r3,"R3", SeaGreen,0);
drawLabel("Resistance 3",r3,White);
drawTrendline(r2,"R2", SeaGreen,0);
drawLabel("Resistance 2",r2,White);
drawTrendline(r1,"R1", SeaGreen,0);
drawLabel("Resistance 1",r1,White);

drawTrendline(p,"PIVIOT",Goldenrod,1);
drawLabel("Piviot level",p,White);

drawTrendline(s1,"S1",SeaGreen,0);
drawLabel("Support 1",s1,White);
drawTrendline(s2,"S2",SeaGreen,0);
drawLabel("Support 2",s2,White);
drawTrendline(s3,"S3",SeaGreen,0);
drawLabel("Support 3",s3,White);


//----
   return(0);
  }
//+------------------------------------------------------------------+
void drawLabel(string name,double lvl,color Color)
{
    if(ObjectFind(name) != 0)
    {
        ObjectCreate(name, OBJ_TEXT, 0, Time[10], lvl);
        ObjectSetText(name, name, 8, "Arial", EMPTY);
        ObjectSet(name, OBJPROP_COLOR, Color);
    }
    else
    {
        ObjectMove(name, 0, Time[10], lvl);
    }
}


void drawTrendline(double lvl,string name, color Col,int type)
{
         if(ObjectFind(name) != 0)
         {
            ObjectCreate(name, OBJ_HLINE, 0, Time[0], lvl,Time[0],lvl);

            if(type == 1)
            ObjectSet(name, OBJPROP_STYLE, STYLE_SOLID);
            else
            ObjectSet(name, OBJPROP_STYLE, STYLE_DOT);

            ObjectSet(name, OBJPROP_COLOR, Col);
            ObjectSet(name,OBJPROP_WIDTH,1);

         }
         else
         {
            ObjectDelete(name);
            ObjectCreate(name, OBJ_HLINE, 0, Time[0], lvl,Time[0],lvl);

            if(type == 1)
            ObjectSet(name, OBJPROP_STYLE, STYLE_SOLID);
            else
            ObjectSet(name, OBJPROP_STYLE, STYLE_DOT);

            ObjectSet(name, OBJPROP_COLOR, Col);
            ObjectSet(name,OBJPROP_WIDTH,1);

         }
}
Comments