CoeffofLine
Download script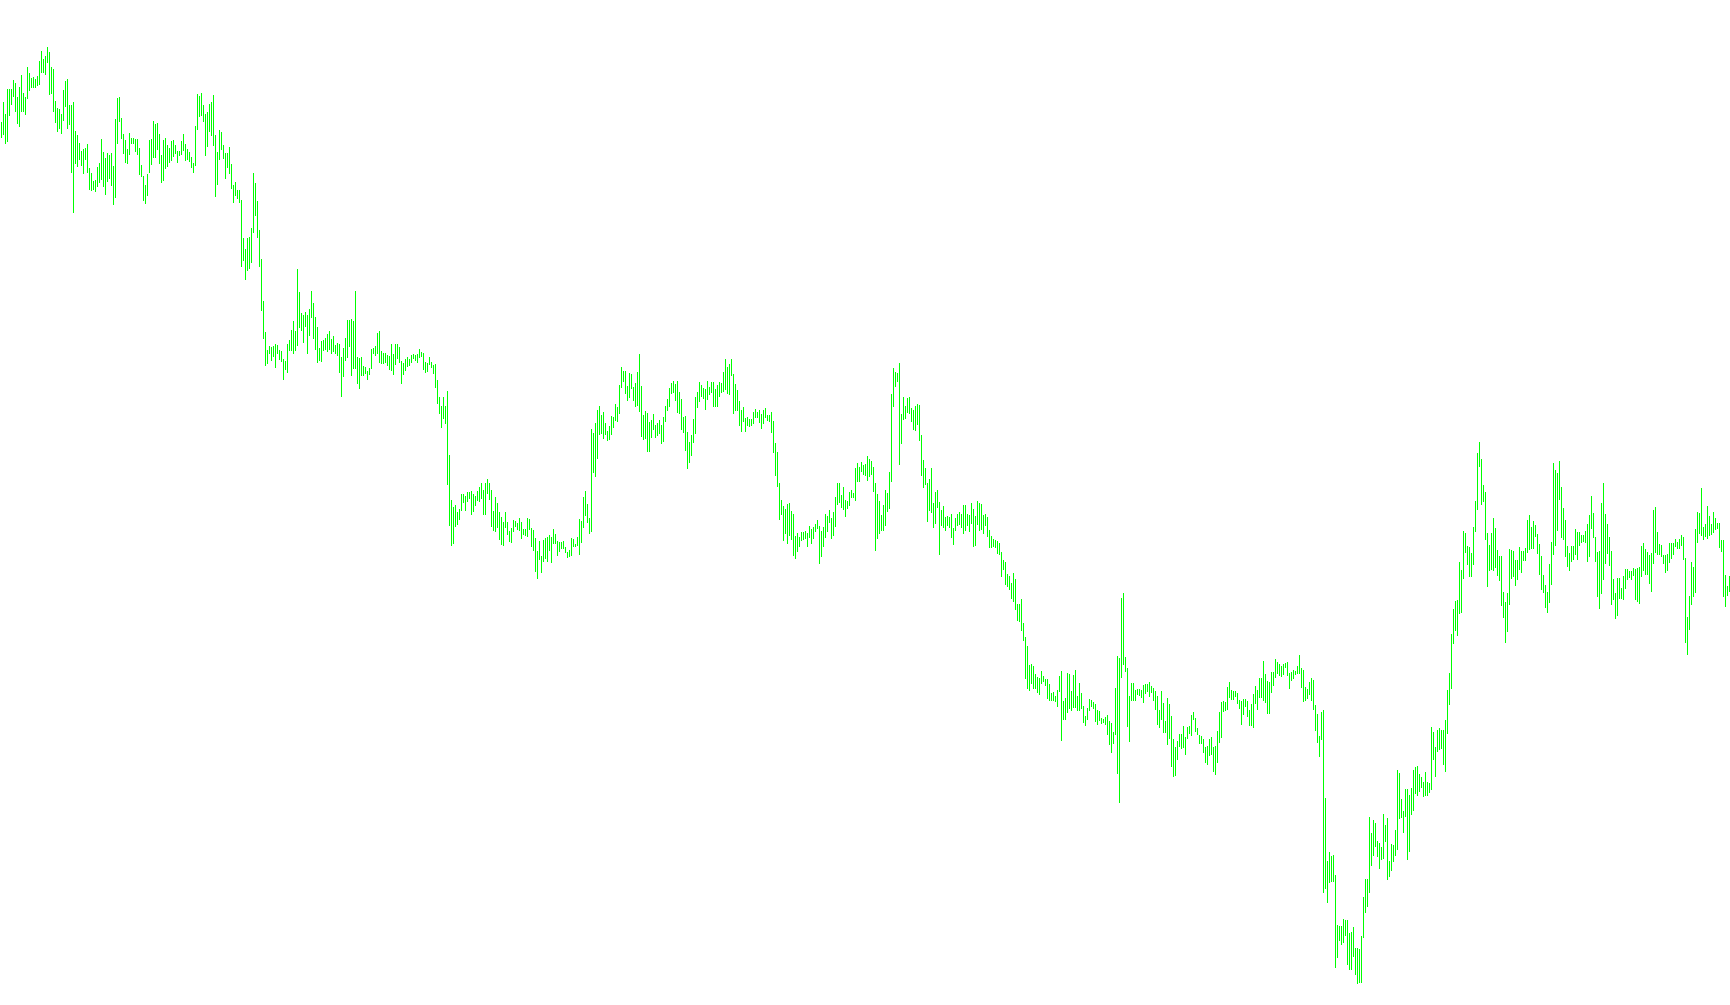
This tool functions as a specialized visual indicator designed to analyze market momentum and price behavior by comparing two distinct types of moving averages. Rather than simply showing price trends, it calculates the mathematical relationship between raw price data and smoothed trend data to highlight specific market dynamics.
Core Logic and Methodology
The script operates through three primary stages to generate its final visual output:
1. Data Collection and Weighting The indicator looks back at a specific number of recent price points (determined by the user). For each point, it gathers the High and Low prices to determine the midpoint. It simultaneously calculates a standard smoothed moving average (SMMA) for the same period. To ensure the most recent data carries more significance, the script applies a weighted calculation, where different positions in the look-back window are assigned different levels of importance.
2. Comparative Analysis The core "engine" of the script performs a complex mathematical comparison between:
- The Raw Price Weighted Average: A custom calculation based on the direct movement of price points.
- The Indicator Weighted Average: The same weighted calculation applied to a smoothed moving average.
By comparing these two figures, the script identifies the "coefficient" or the gap between actual price action and the underlying smoothed trend. It uses logarithmic scaling to process this relationship, which helps in identifying whether the price is reacting more aggressively than the trend suggests or vice versa.
3. Visual Output and Currency Filtering The final result is displayed as a histogram in a separate window below your main chart. The tool features a specific logic gate for different currency pairs:
- Major Pairs: For common currencies like EURUSD, GBPUSD, etc., the script applies a negative multiplier to the calculation.
- Other Pairs: For all other assets, it applies a positive multiplier.
This distinction ensures that the visual representation of the data remains consistent and readable regardless of which currency pair you are trading. The resulting histogram allows traders to see the "Coefficient of Line" as a single, unified visual metric for assessing market behavior.
//+------------------------------------------------------------------+
//|                                                 CoeffofLine.mq4  |
//|                                       Ramdass - Conversion only  |
//+------------------------------------------------------------------+

#property indicator_separate_window
#property indicator_buffers 1
#property indicator_color1 Blue
//----
extern int ndot = 5;
extern int CountBars = 300;
//---- buffers
double cfl[];
//+------------------------------------------------------------------+
//| Custom indicator initialization function                         |
//+------------------------------------------------------------------+
int init()
  {
//---- indicator line
   SetIndexStyle(0, DRAW_HISTOGRAM);
   SetIndexBuffer(0, cfl);
//----
   IndicatorShortName("CoeffofLine(" + ndot + ")");
//----
   if(CountBars >= Bars)
       CountBars=Bars;
   SetIndexDrawBegin(0, Bars - CountBars + ndot + 1);
//----
   return(0);
  }
//+------------------------------------------------------------------+
//| CoeffofLine_v1                                                   |
//+------------------------------------------------------------------+
int start()
  {
   int i, shift, cnt, ndot1, counted_bars = IndicatorCounted();
   double TYVar, ZYVar, TIndicatorVar, ZIndicatorVar, M, N, AY, AIndicator;
//----
   if(Bars <= ndot)
       return(0);
//----
   if(counted_bars < ndot)
       return(0);
   shift = Bars - CountBars - ndot - 1;
//----
   while(shift >= 0)
     {
       TYVar = 0;
	      ZYVar = 0;
	      N = 0;
	      M = 0;
	      TIndicatorVar = 0;
	      ZIndicatorVar = 0;
	      ndot1 = ndot;
	      //----
       if(shift + 1 < ndot1)
	          ndot1 = shift + 1;
	      //----
       for(cnt = ndot; cnt >= 1; cnt--) // n=5 -  ïî ïÿòè òî÷êàì
	        {
		         N = N + cnt*cnt;  //ðàâíî 55
		         M = M + cnt;      //ðàâíî 15
	        }
	      //----
       for(cnt = ndot1; cnt >= 1; cnt--) // n=5 -  ïî ïÿòè òî÷êàì
	        {
		         ZYVar = ZYVar + (High[shift-cnt+1] + Low[shift-cnt+1]) / 2*(ndot + 1 - cnt);
		         TYVar = TYVar + (High[shift-cnt+1] + Low[shift-cnt+1]) / 2;
		         ZIndicatorVar = ZIndicatorVar + iMA(NULL, 0, 5, 3, MODE_SMMA, PRICE_MEDIAN,
		                         shift - cnt + 1)*(ndot + 1 - cnt);
		         TIndicatorVar = TIndicatorVar + iMA(NULL, 0, 5, 3, MODE_SMMA, PRICE_MEDIAN,
		                         shift - cnt + 1);
	        }
	      AY = (TYVar + (N - 2*ZYVar)*ndot / M) / M;
	      AIndicator = (TIndicatorVar + (N - 2*ZIndicatorVar)*ndot / M) / M;
	      //----
       if(Symbol() == "EURUSD" || Symbol() == "GBPUSD" || Symbol() == "USDCAD" ||
	         Symbol() == "USDCHF" || Symbol() == "EURGBP" || Symbol() == "EURCHF" ||
	         Symbol() == "AUDUSD" || Symbol() == "GBPCHF")
	        {
	          cfl[shift] = (-1000)*MathLog(AY / AIndicator);
	        }
	      else
	        {
	          cfl[shift] = (1000)*MathLog(AY / AIndicator);
	        }
       shift--;
     }
   return(0);
  }
//+------------------------------------------------------------------+
Comments