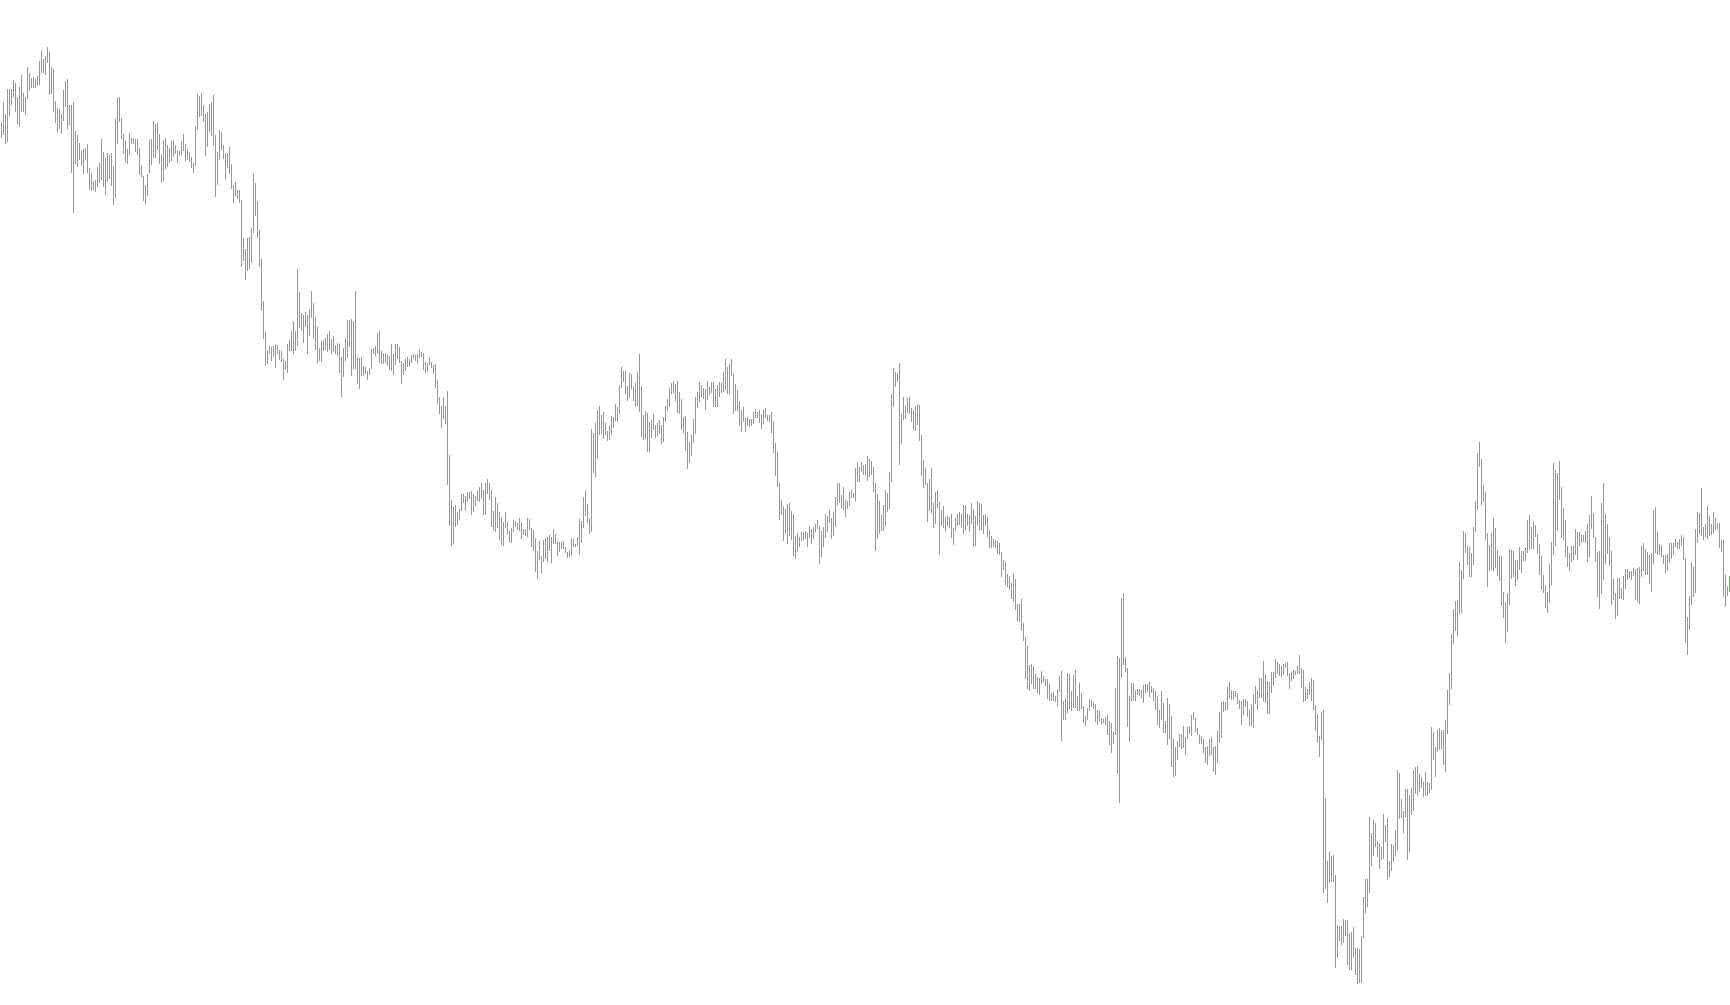
This tool is designed as a technical analysis indicator for the MetaTrader platform, specifically engineered to calculate and visualize a customized coefficient based on price action dynamics. Rather than following standard moving averages alone, it seeks to identify specific momentum shifts by comparing raw price data against smoothed trend data.
How the Logic Works
Data Processing and Smoothing The script analyzes a specific window of historical price bars (user-definable) to evaluate current market behavior. It simultaneously looks at two different types of data:
- Raw Price Points: It calculates the median price (the midpoint between the high and low) for the most recent bars.
- Smoothed Trends: It applies a Smoothed Moving Average (SMMA) to those same points to determine the underlying trend.
The Core Calculation (Weighted Comparison) The engine uses a weighted mathematical formula to compare these two data sets. By applying specific weights to the price points relative to their position in time, it creates two distinct variables:
- A primary value derived from raw prices (AY).
- A secondary value derived from the smoothed moving average (AIndicator).
By comparing these two values against each other, the script measures the "distance" or discrepancy between current price action and the established trend.
Signal Generation and Alerts The logic includes an automated monitoring system that watches for specific directional shifts:
- Buy Signals: If both the raw price value and the smoothed trend value cross into a positive territory simultaneously, the system triggers a "Buy" alert.
- Sell Signals: If both values drop into negative territory at the same time, the system triggers a "Sell" alert.
The script also provides an audible notification to ensure these signals are noticed in real-time.
Visual Output (The Coefficient Line) Finally, the script translates this relationship into a visual line on your chart's separate window. The logic adjusts the calculation based on the specific currency pair being traded:
- For major pairs like EURUSD, GBPUSD, and others listed in the code, it applies a negative logarithmic transformation to the result.
- For all other pairs, it applies a positive logarithmic transformation.
This results in a yellow line that represents the relative strength or "coefficient" of the current price movement, helping traders visualize the intensity of the market's momentum.
//+------------------------------------------------------------------+
//| CoeffofLine.mq4
//| Ramdass - Conversion only
//+------------------------------------------------------------------+

#property indicator_separate_window
#property indicator_buffers 1
#property indicator_color1 Yellow


extern int ndot=5;
extern int CountBars=300;
//---- buffers
double cfl[];


//+------------------------------------------------------------------+
//| Custom indicator initialization function                         |
//+------------------------------------------------------------------+
int init()
  {
   string short_name;
//---- indicator line
   IndicatorBuffers(1);
   SetIndexStyle(0,DRAW_LINE);
   SetIndexBuffer(0,cfl);
//----
   return(0);
  }
//+------------------------------------------------------------------+
//| CoeffofLine_v1                                                              |
//+------------------------------------------------------------------+
int start()
  {


   if (CountBars>=Bars) CountBars=Bars;
   SetIndexDrawBegin(0,Bars-CountBars+ndot+1);
   int i,shift,cnt,ndot1,counted_bars=IndicatorCounted();
   double TYVar,ZYVar,TIndicatorVar,ZIndicatorVar,M,N,AY,AIndicator;
//----
   if(Bars<=ndot) return(0);

//----
   shift=CountBars-ndot-1;


   while(shift>=0)
     {

   TYVar=0;
	ZYVar=0;
	N=0;
	M=0;
	TIndicatorVar=0;
	ZIndicatorVar=0;
	ndot1=ndot;
	if (shift+1<ndot1) ndot1=shift+1;
	for (cnt=ndot; cnt>=1; cnt--) // n=5 -  ïî ïÿòè òî÷êàì
	{
		N=N+cnt*cnt;  //ðàâíî 55
		M=M+cnt;      //ðàâíî 15
	}
	for (cnt=ndot1; cnt>=1; cnt--) // n=5 -  ïî ïÿòè òî÷êàì
	{
		ZYVar=ZYVar+(High[shift-cnt+1]+Low[shift-cnt+1])/2*(ndot+1-cnt);
		TYVar=TYVar+(High[shift-cnt+1]+Low[shift-cnt+1])/2;
		ZIndicatorVar=ZIndicatorVar+iMA(NULL,0,5,3,MODE_SMMA,PRICE_MEDIAN,shift-cnt+1)*(ndot+1-cnt);
		TIndicatorVar=TIndicatorVar+iMA(NULL,0,5,3,MODE_SMMA,PRICE_MEDIAN,shift-cnt+1);
	}
	AY=(TYVar+(N-2*ZYVar)*ndot/M)/M;
	AIndicator=(TIndicatorVar+(N-2*ZIndicatorVar)*ndot/M)/M;

	if(AY < 0) {
      if(AIndicator < 0) {
         Alert(""," for ", Symbol(),"Sell",Period());
         PlaySound("alert2.wav");
      }
   }
   else if(AY > 0) {
      if((AIndicator > 0)) {
         Alert(""," for ", Symbol(),"Buy",Period());
         PlaySound("alert2.wav");
      }
   }


	if (Symbol()=="EURUSD" || Symbol()=="GBPUSD" || Symbol()=="USDCAD" || Symbol()=="USDCHF"
	 || Symbol()=="EURGBP" || Symbol()=="EURCHF" || Symbol()=="AUDUSD"
	 || Symbol()=="GBPCHF")
	{cfl[shift]=(-1000)*MathLog(AY/AIndicator);}
	else {cfl[shift]=(1000)*MathLog(AY/AIndicator);}


      shift--;
     }
   return(0);
  }
//+------------------------------------------------------------------+
Comments