CMO_v1_v1
Download script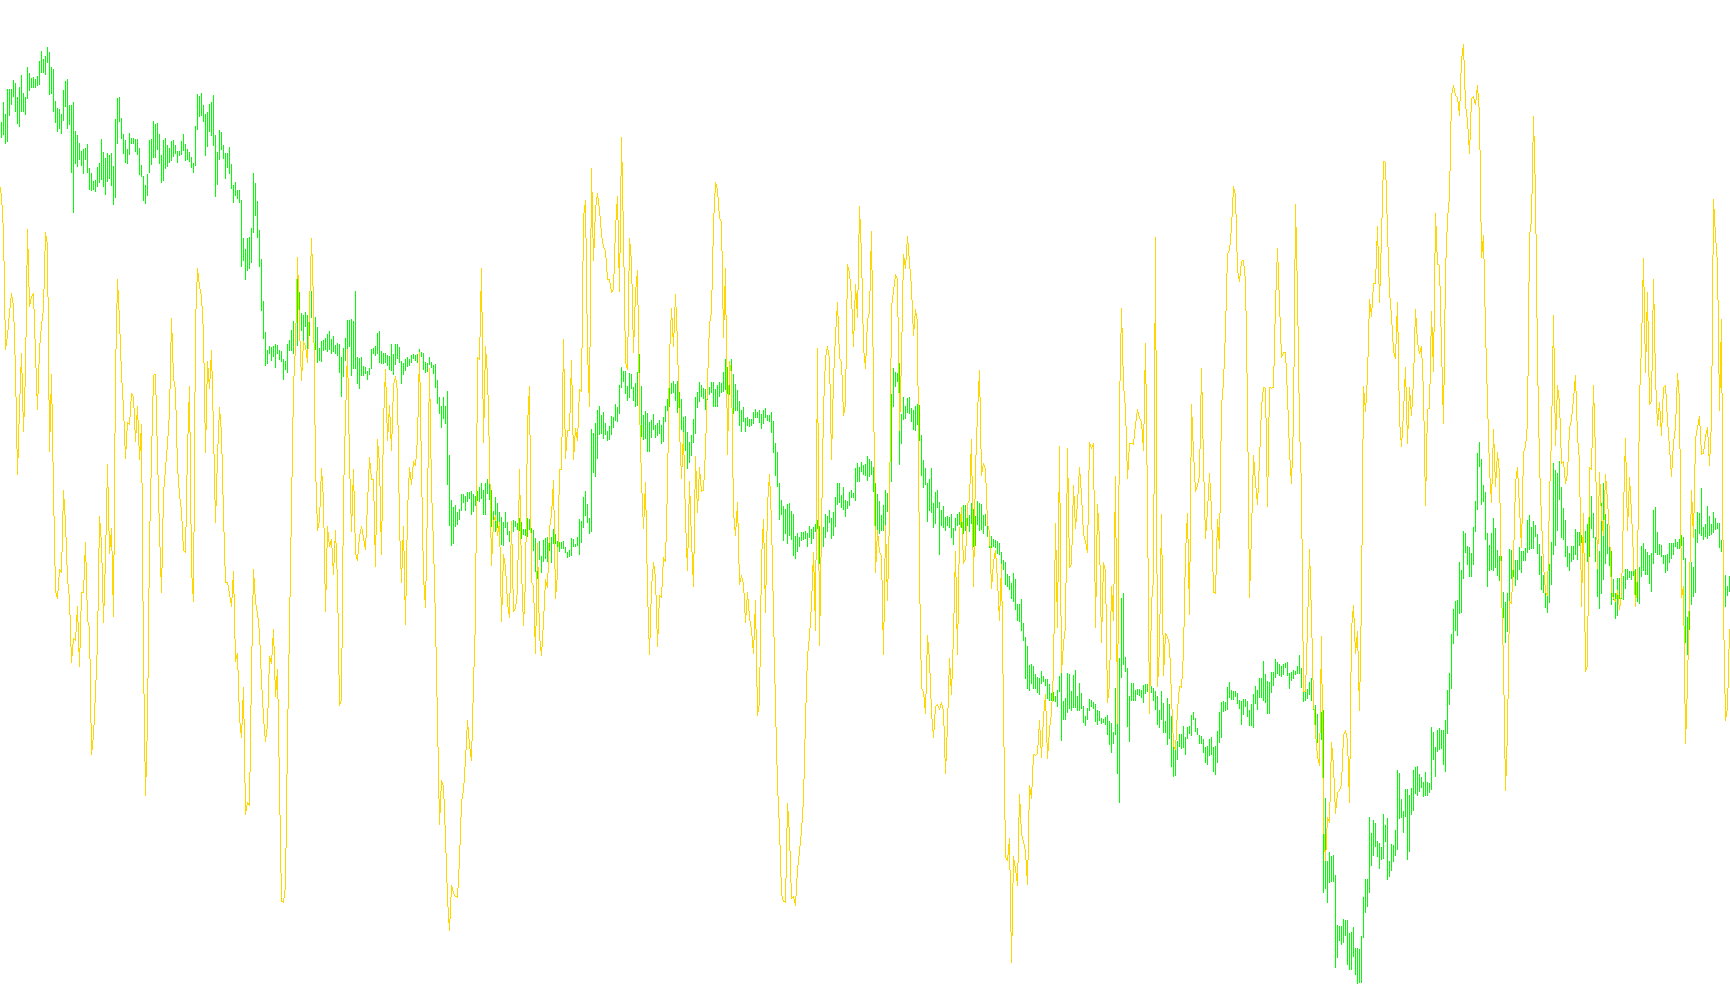
This tool is designed to measure and visualize the "sentiment" of a financial market by calculating the momentum between buyers and sellers. Instead of simply looking at price movement, it attempts to distinguish between aggressive buying pressure and aggressive selling pressure over a specific period.
How the Logic Works
1. Data Selection and Filtering The tool begins by looking at a specific set of price data (such as the closing price, opening price, or the high/low range) across a user-defined timeframe. By allowing you to choose different price types, the tool can be adjusted to suit different trading styles—whether you prefer focusing on the "typical" average price or the extreme highs and lows of a candle.
2. Identifying Individual Movements The script analyzes the change in price from one moment to the next. It breaks down these changes into two distinct components:
- Bullish Strength: How much of the price move was driven by upward momentum?
- Bearish Strength: How much of the price move was driven by downward momentum?
By separating these forces, the tool can "see" how much energy is being pushed into the market from both sides.
3. Calculating Momentum Balance (The CMO) Once it has identified the strength of the bulls and the bears over your chosen period, it performs a calculation to find the balance between them:
- It totals the bullish strength and the bearish strength over the entire look-back window.
- It then compares these two sums to create a percentage score.
4. Visual Interpretation The result is displayed as an oscillator in a separate window, ranging from -100 to +100:
- Positive Values: Indicate that buying pressure (bullish sentiment) is currently dominating the market.
- Negative Values: Indicate that selling pressure (bearish sentiment) is currently dominating the market.
- Zero Line: Represents a neutral state where neither side holds a clear advantage in momentum.
In simple terms, this script acts as a "momentum scale." It tells you which side of the market has more weight behind it at any given time, helping you identify whether the current trend is being fueled by aggressive buying, aggressive selling, or a balanced tug-of-war.
/*-----------------------------+
|			       |
| Shared by www.Aptrafx.com    |
|			       |
+------------------------------*/

//+------------------------------------------------------------------+
//|                                                       CMO_v1.mq4 |
//|                           Copyright © 2006, TrendLaboratory Ltd. |
//|            http://finance.groups.yahoo.com/group/TrendLaboratory |
//|                                       E-mail: igorad2004@list.ru |
//+------------------------------------------------------------------+
#property copyright "Copyright © 2006, TrendLaboratory Ltd."
#property link      "http://finance.groups.yahoo.com/group/TrendLaboratory"

#property indicator_separate_window
#property indicator_buffers   1
#property indicator_color1    LightBlue
#property indicator_width1    2
#property indicator_level1    0
#property indicator_level2   50
#property indicator_level3  -50
#property indicator_maximum  100
#property indicator_minimum -100
//---- input parameters
extern int       Length = 14; // Period of evaluation
extern int       Price  =  0; // Price mode : 0-Close,1-Open,2-High,3-Low,4-Median,5-Typical,6-Weighted

//---- buffers
double CMO[];
double Bulls[];
double Bears[];

//+------------------------------------------------------------------+
//| Custom indicator initialization function                         |
//+------------------------------------------------------------------+
int init()
  {
//---- indicators
   IndicatorBuffers(3);
   SetIndexStyle(0,DRAW_LINE);
   SetIndexBuffer(0,CMO);
   SetIndexBuffer(1,Bulls);
   SetIndexBuffer(2,Bears);
//---- name for DataWindow and indicator subwindow label
   string short_name="CMO("+Length+","+Price+")";
   IndicatorShortName(short_name);
   SetIndexLabel(0,"CMO");
//----
   SetIndexDrawBegin(0,Length);

   return(0);
  }

//+------------------------------------------------------------------+
//| Custom indicator iteration function                              |
//+------------------------------------------------------------------+
int start()
  {
   int      shift, limit, counted_bars=IndicatorCounted();
   double   Price1, Price2;
//----
   if ( counted_bars < 0 ) return(-1);
   if ( counted_bars ==0 ) limit=Bars-Length-1;
   if ( counted_bars < 1 )
   for(int i=1;i<Length;i++)
   {
   Bulls[Bars-i]=0;
   Bears[Bars-i]=0;
   CMO[Bars-i]=0;
   }


   if(counted_bars>0) limit=Bars-counted_bars;
   limit--;

   for( shift=limit; shift>=0; shift--)
   {
   Price1 = iMA(NULL,0,1,0,0,Price,shift);
   Price2 = iMA(NULL,0,1,0,0,Price,shift+1);

   Bulls[shift] = 0.5*(MathAbs(Price1-Price2)+(Price1-Price2));
   Bears[shift] = 0.5*(MathAbs(Price1-Price2)-(Price1-Price2));

   double SumBulls = 0, SumBears=0;
      for (i=0;i<Length;i++)
      {
      SumBulls += Bulls[shift+i];
      SumBears += Bears[shift+i];
      }
   CMO[shift] = (SumBulls-SumBears)/(SumBulls+SumBears)*100;
   }
   /*
   for( shift=limit; shift>=0; shift--)
   {
   double AvgBulls=iMAOnArray(Bulls,0,Length,0,0,shift);
   double AvgBears=iMAOnArray(Bears,0,Length,0,0,shift);

   CMO[shift] = (AvgBulls-AvgBears)/(AvgBulls+AvgBears)*100;
   }
   */
//----
   return(0);
  }
//+------------------------------------------------------------------+
Comments