CMO_v1_v2
Download script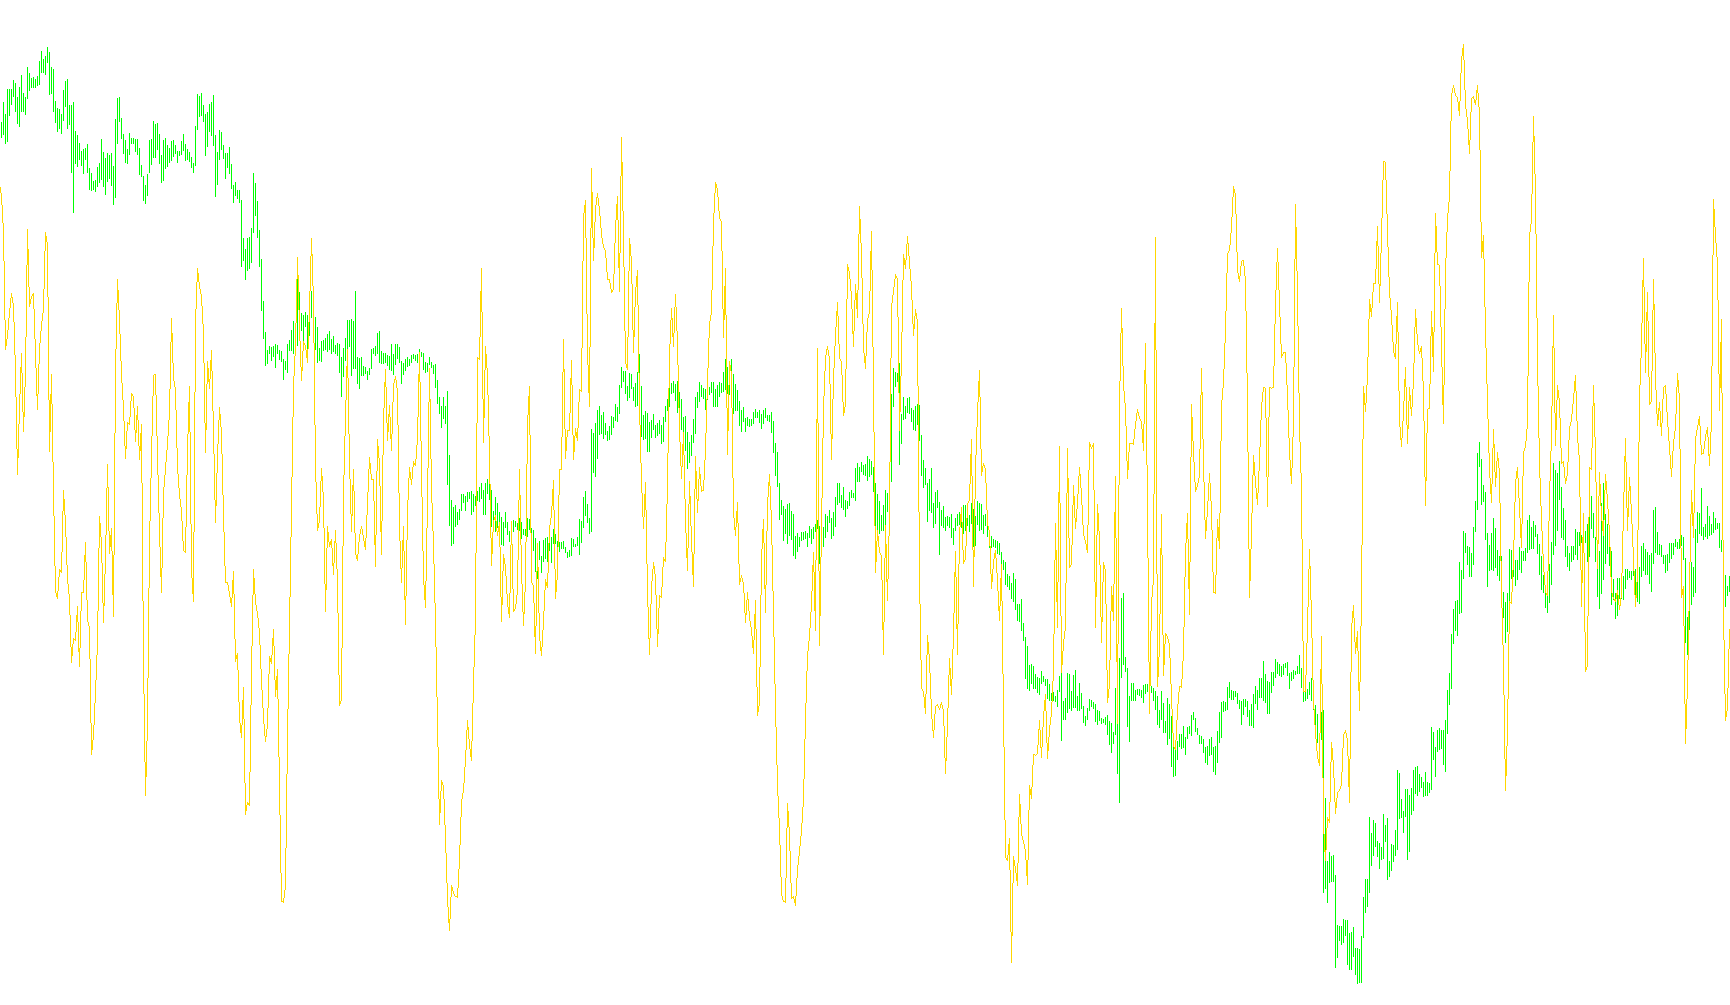
This tool is designed as a momentum oscillator, specifically used to gauge the strength and direction of price movements in a financial market. By visualizing the tug-of-war between buyers (bulls) and sellers (bears), it helps traders identify whether a current trend is gaining steam or losing its underlying power.
How the Logic Works
The script operates by breaking down every price movement into two distinct components: "Bullish Strength" and "Bearish Strength." Rather than just looking at the final price, it analyzes how the price changes from one moment to the next.
1. Capturing Momentum Direction For every period, the tool compares the current price action against the previous price action. It calculates the difference between these two points. If the price moves up, the movement is attributed to bullish force; if it moves down, it is attributed to bearish force.
2. Quantifying Strength The logic applies a mathematical transformation to these movements to ensure that the "magnitude" of the move is preserved. By separating the data into two separate internal values—one for bulls and one for bears—the script can track not just where the price is going, but how much effort is being exerted by each side.
3. The Cumulative Evaluation Instead of reacting only to the most recent second of trading, the tool looks back over a customizable period (defined by the "Length" parameter). It sums up all the bullish energy and all the bearish energy across this timeframe.
4. The Final Calculation The final result displayed on your chart is a percentage-based oscillator. It takes the total Bullish sum, subtracts the Bearish sum, and divides it by the total combined energy of both sides. This is then converted into a percentage scale ranging from -100 to +100.
How to Interpret the Results
- Positive Values: When the line moves toward the top of the window (toward +100), it indicates that bullish momentum is dominating the market.
- Negative Values: When the line drops toward the bottom (toward -100), it indicates that bearish pressure is taking control.
- Zero Line: This represents a state of equilibrium where neither buyers nor sellers have a clear advantage.
- Trend Strength: A sharp move toward either extreme suggests a very strong, aggressive trend, while a flattening line near zero suggests a period of indecision or "choppy" price action.
//+------------------------------------------------------------------+
//|                                                       CMO_v1.mq4 |
//|                           Copyright © 2006, TrendLaboratory Ltd. |
//|            http://finance.groups.yahoo.com/group/TrendLaboratory |
//|                                       E-mail: igorad2004@list.ru |
//+------------------------------------------------------------------+
#property copyright "Copyright © 2006, TrendLaboratory Ltd."
#property link      "http://finance.groups.yahoo.com/group/TrendLaboratory"
//----
#property indicator_separate_window
#property indicator_buffers   1
#property indicator_color1    LightBlue
#property indicator_width1    2
#property indicator_level1    0
#property indicator_level2   50
#property indicator_level3  -50
#property indicator_maximum  100
#property indicator_minimum -100
//---- input parameters
extern int       Length=14; // Period of evaluation
extern int       Price=0;   // Price mode : 0-Close,1-Open,2-High,3-Low,4-Median,5-Typical,6-Weighted
//---- buffers
double CMO[];
double Bulls[];
double Bears[];
//+------------------------------------------------------------------+
//| Custom indicator initialization function                         |
//+------------------------------------------------------------------+
int init()
  {
//---- indicators
   IndicatorBuffers(3);
   SetIndexStyle(0,DRAW_LINE);
   SetIndexBuffer(0,CMO);
   SetIndexBuffer(1,Bulls);
   SetIndexBuffer(2,Bears);
//---- name for DataWindow and indicator subwindow label
   string short_name="CMO("+Length+","+Price+")";
   IndicatorShortName(short_name);
   SetIndexLabel(0,"CMO");
//----
   SetIndexDrawBegin(0,Length);
//----
   return(0);
  }
//+------------------------------------------------------------------+
//| Custom indicator iteration function                              |
//+------------------------------------------------------------------+
int start()
  {
   int      shift, limit, counted_bars=IndicatorCounted();
   double   Price1, Price2;
//----
   if(counted_bars < 0)return(-1);
   if(counted_bars ==0)limit=Bars-Length-1;
   if(counted_bars < 1)
      for(int i=1;i<Length;i++)
        {
         Bulls[Bars-i]=0;
         Bears[Bars-i]=0;
         CMO[Bars-i]=0;
        }
   if(counted_bars>0) limit=Bars-counted_bars;
   limit--;
//----
   for( shift=limit; shift>=0; shift--)
     {
      Price1=iMA(NULL,0,1,0,0,Price,shift);
      Price2=iMA(NULL,0,1,0,0,Price,shift+1);
      //
      Bulls[shift]=0.5*(MathAbs(Price1-Price2)+(Price1-Price2));
      Bears[shift]=0.5*(MathAbs(Price1-Price2)-(Price1-Price2));
//----
      double SumBulls=0, SumBears=0;
      for(i=0;i<Length;i++)
        {
         SumBulls+=Bulls[shift+i];
         SumBears+=Bears[shift+i];
        }
      CMO[shift]=(SumBulls-SumBears)/(SumBulls+SumBears)*100;
     }
   /*
   for( shift=limit; shift>=0; shift--)
   {
   double AvgBulls=iMAOnArray(Bulls,0,Length,0,0,shift);
   double AvgBears=iMAOnArray(Bears,0,Length,0,0,shift);
   CMO[shift] = (AvgBulls-AvgBears)/(AvgBulls+AvgBears)*100;
   }
   */
//----
   return(0);
  }
//+------------------------------------------------------------------+
Comments