EMABands_v1_v2
Download script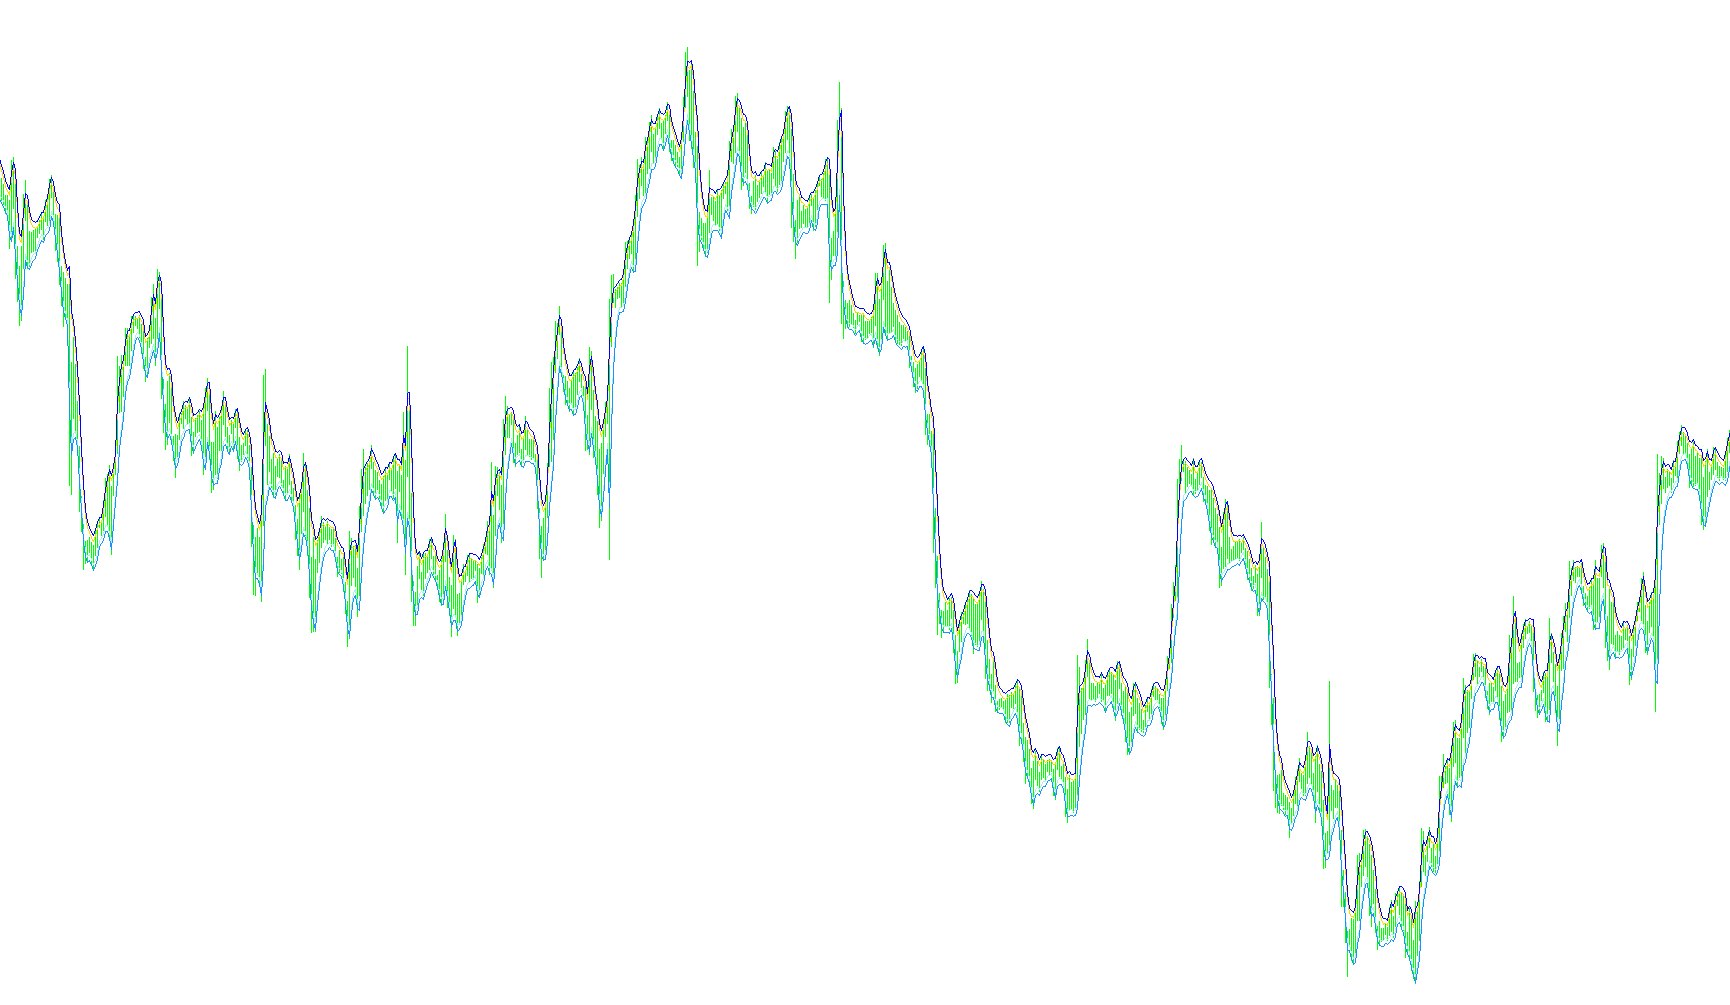
The EMABands indicator is designed to provide traders with a visual framework for identifying price trends and potential reversal zones by layering specific mathematical averages onto your trading chart. Rather than looking at a single data point, this tool creates a "channel" of information that helps clarify the direction of market movement.
Core Logic and Functionality
The indicator operates by calculating four distinct lines based on the highest and lowest prices reached during a specific timeframe. Here is how the logic breaks down:
- Trend Tracking: The script looks at the "High" and "Low" price points over a user-defined period (the Length). By using these extremes instead of just the closing price, it provides a more comprehensive view of the market's volatility and range.
- The Upper Boundary: It establishes two upper lines. The first is a standard moving average of the highest prices; the second sits slightly above it at a fixed distance. This helps identify the "ceiling" of the current price action.
- The Lower Boundary: Similarly, it establishes two lower lines. The first is a moving average of the lowest prices, and the second sits below it at a fixed distance. This helps identify the "floor" of the current price movement.
- Volatility Buffer (Delta): A key feature of this script is the "Delta" setting. This allows the tool to create a specific gap between the moving averages and the outer bands. This buffer acts as a visual cushion, helping traders see how much room the market has to breathe before hitting a significant resistance or support level.
How to Interpret the Visuals
When you view these four lines on your chart, they form a dynamic band that follows the price:
- Price Direction: When the price is hugging the upper bands, it suggests a strong bullish (upward) trend. When it stays near the lower bands, it indicates a bearish (downward) trend.
- Support and Resistance: The outer bands (the ones adjusted by the Delta) serve as visual markers for potential "turning points." If the price approaches these lines and struggles to break through, it may signal that the current trend is weakening.
- Channel Width: The space between the upper and lower sets of lines can also give you a sense of market sentiment; a widening gap often suggests increasing volatility, while a narrowing gap may indicate a period of consolidation or tightening price action.
In summary, this script transforms raw high and low data into a structured visual channel, allowing you to see the "boundaries" of the market more clearly.
//+------------------------------------------------------------------+
//|                                                  EMABands_v1.mq4 |
//|                                  Copyright © 2006, Forex-TSD.com |
//|                         Written by IgorAD,igorad2003@yahoo.co.uk |
//|            http://finance.groups.yahoo.com/group/TrendLaboratory |
//+------------------------------------------------------------------+
#property copyright "Copyright © 2006, Forex-TSD.com "
#property link      "http://www.forex-tsd.com/"
//----
#property indicator_chart_window
#property indicator_buffers 4
#property indicator_color1 Blue
#property indicator_color2 Aqua
#property indicator_color3 Red
#property indicator_color4 Magenta
//---- input parameters
extern int Length=3;
extern int MA_mode=1;
extern int Delta=15;
//---- indicator buffers
double UpBuffer1[];
double UpBuffer2[];
double DnBuffer1[];
double DnBuffer2[];
//+------------------------------------------------------------------+
//| Custom indicator initialization function                         |
//+------------------------------------------------------------------+
  int init()
  {
   string short_name;
//---- indicator line
   SetIndexStyle(0,DRAW_LINE);
   SetIndexStyle(1,DRAW_LINE);
   SetIndexStyle(2,DRAW_LINE);
   SetIndexStyle(3,DRAW_LINE);
//----
   SetIndexBuffer(0,UpBuffer1);
   SetIndexBuffer(1,UpBuffer2);
   SetIndexBuffer(2,DnBuffer1);
   SetIndexBuffer(3,DnBuffer2);
//---- name for DataWindow and indicator subwindow label
   short_name="EMABands("+Length+")";
   IndicatorShortName(short_name);
   SetIndexLabel(0,"Up1");
   SetIndexLabel(1,"Up2");
   SetIndexLabel(2,"Dn1");
   SetIndexLabel(3,"Dn2");
//----
   SetIndexDrawBegin(0,Length);
   SetIndexDrawBegin(1,Length);
   SetIndexDrawBegin(2,Length);
   SetIndexDrawBegin(3,Length);
//----
   return(0);
  }
//+------------------------------------------------------------------+
//| EMABands_v1                                                     |
//+------------------------------------------------------------------+
int start()
  {
   int shift,limit, counted_bars=IndicatorCounted();
//----
   if(counted_bars > 0) limit=Bars-counted_bars;
   if(counted_bars < 0) return(0);
   if(counted_bars ==0) limit=Bars-Length-1;
//----
   for(shift=limit;shift>=0;shift--)
     {
      UpBuffer1[shift]=iMA(NULL,0,Length,0,MA_mode,PRICE_HIGH,shift);
      UpBuffer2[shift]=UpBuffer1[shift] + Delta*Point;
      DnBuffer1[shift]=iMA(NULL,0,Length,0,MA_mode,PRICE_LOW,shift);
      DnBuffer2[shift]=DnBuffer1[shift] - Delta*Point;
     }
   return(0);
  }
//+------------------------------------------------------------------+
Comments