JMASlope_MTF_001
Download script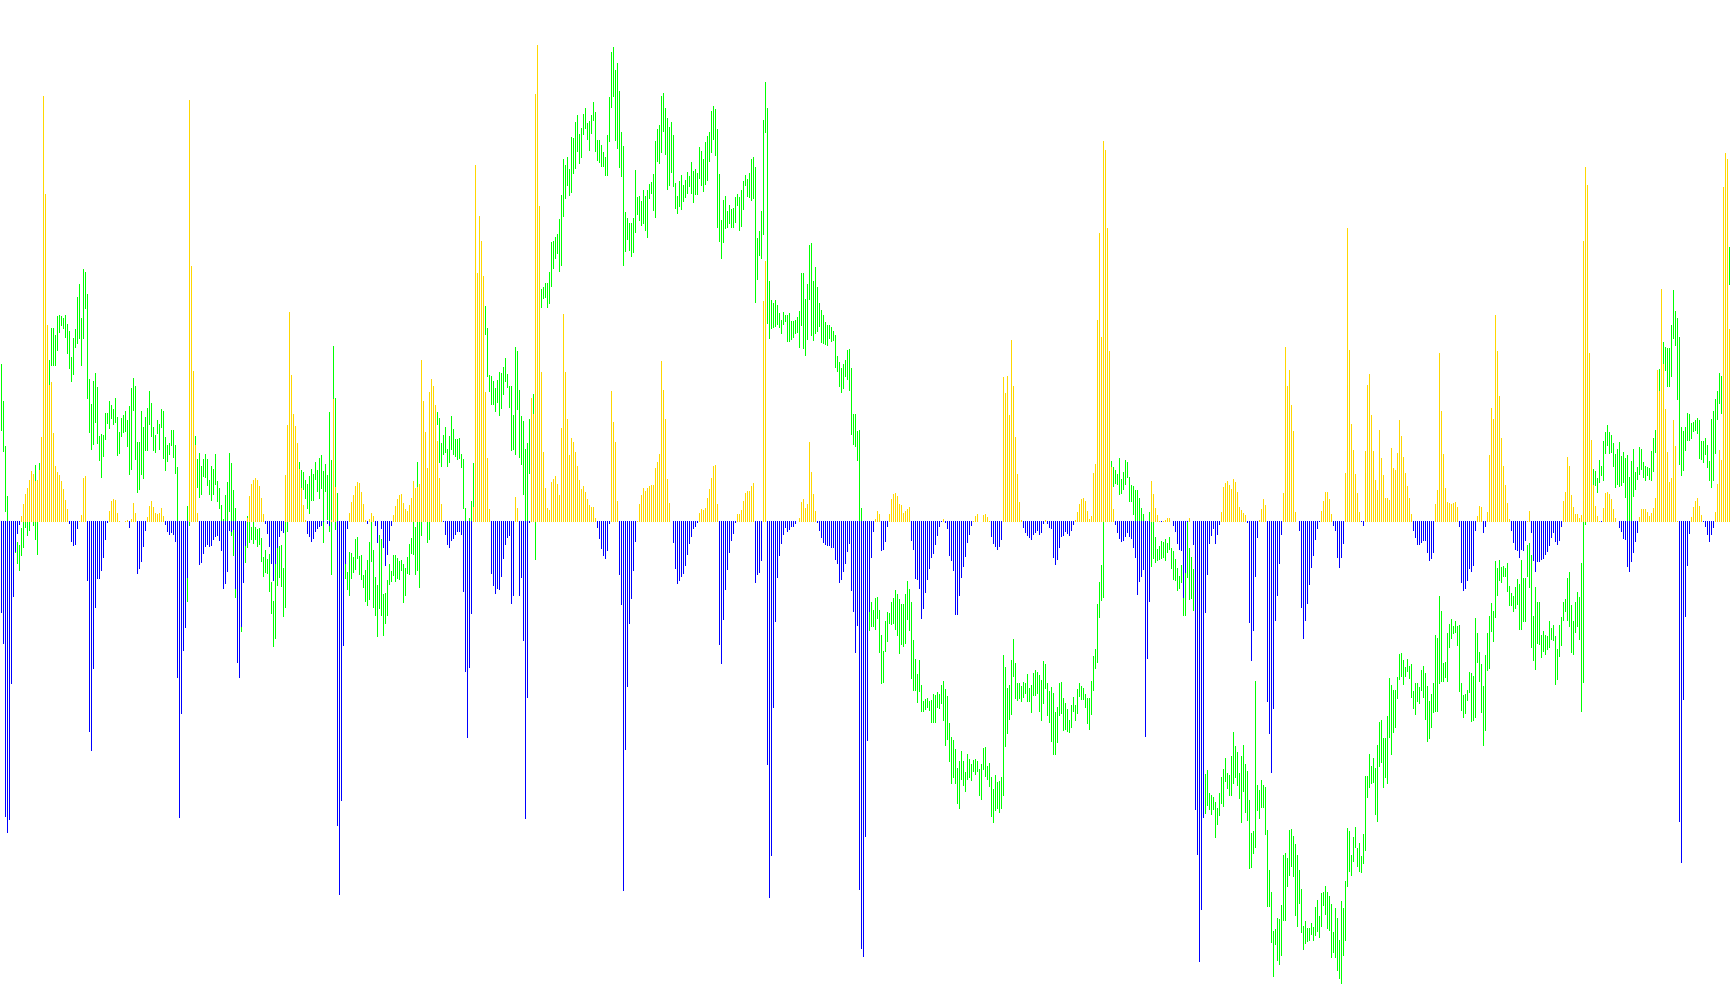
This script is designed to enhance your trading chart by pulling and displaying data from a specific technical analysis tool (the JMASlope indicator) across different timeframes simultaneously.
Essentially, it acts as a "bridge" that allows you to see long-term market trends without having to constantly switch between different charts. Here is a breakdown of how the logic works:
Multi-Timeframe Integration
The primary purpose of this script is its ability to look at larger timeframes. For example, if you are currently viewing a 15-minute chart but want to see the momentum or slope calculated on a 4-hour chart, this script fetches that higher-level data and overlays it onto your current view. This helps traders stay aware of the "big picture" while making decisions on smaller price movements.
How It Processes Data
The script operates through a specific sequence of logic:
- Configuration: You can define which timeframe you want to track, the specific length of the calculation, and the phase of the data. You can also specify the name of the base indicator it should pull from.
- Time Alignment: Because different timeframes have different numbers of candles (bars), the script automatically calculates where the current time on your small chart aligns with the corresponding bar on the larger timeframe. It "shifts" the data to ensure that the information you see is synchronized correctly with the current moment in time.
- Dual-Stream Visualization: The logic specifically looks for two separate values from the base indicator—typically representing upward and downward movements. It then paints these as two distinct histograms:
- One set of bars (usually colored green) represents the upward momentum or slope.
- The second set of bars (usually colored red) represents the downward momentum or slope.
Safety Features
To ensure the chart remains readable and the data stays accurate, the script includes a built-in check: it will alert you if you try to select a timeframe that is smaller than the one you are currently viewing. This prevents the display of "jittery" or illogical data that would occur if you tried to squeeze too much granular information into a larger visual space.
In summary, this tool provides a way to visualize high-level momentum trends directly on your active trading screen, helping you identify whether the broader market direction supports your current trade.
//+------------------------------------------------------------------+
//|                                                 JMASlope_MTF.mq4 |
//|                      Copyright © 2007, ASystem Group             |
//|                                        asystem2000@rambler.ru    |
//+------------------------------------------------------------------+
#property copyright "Copyright © 2007, Asystem2000"
#property link      "asystem2000@rambler.ru"

// Ïðîñòîé èíäèêàòîð, êîòîðûé êîòîðûé ïîçâîëÿåò ïîñòðîèòü â ðàçíûõ òàéìôðåéìàõ àíàëîã èíäèêàòîðà JMASlope
// Åñëè ó Âàñ áàçîâûé èíäèêàòîð JMASlope èìååò äðóãîå íàçâàíèå èñïðàâüòå â ïàðàìåòðå Indicator
// Òåîðåòè÷åñêè ýòîò èíèäèêàòîð ìîæåò îáñëóæèòü ëþáîé èíèäèêàòîð è ïîñòðîèòü åãî ãèñòîãðàììó â ðàçíûõ
// òàéìôðåéìàõ.
// Åäèíñòâåííîå óñëîâèå: áàçîâûé èíäèêàòîð äîëæåí èìåòü äâà âõîäíûõ ïàðàìåòðà ñ òèïîì integer

#property indicator_separate_window
#property indicator_buffers 2
#property indicator_color1 LimeGreen
#property indicator_color2 Red
//---- input parameters
extern int       TimeFrame=0;
extern int       Length=14;
extern int       Phase=0;
//extern string    Note="Ìîæåòå ïîìåíÿòü èìÿ èíèäèêàòîðà, åñëè íå ñîâïàäàåò";
extern string    Note="if required indicator''s name changed, enter a new name";
extern string    Indicator="JMASlope";

//---- buffers
double B_Up[];
double B_Dn[];
//+------------------------------------------------------------------+
//| Custom indicator initialization function                         |
//+------------------------------------------------------------------+
int init()
  {
  if (TimeFrame!=0)
  {
  if (TimeFrame<Period())
     {
 //  Alert("Íàñòðàèâàåìûé òàéìôðåéì äîëæåí áûòü áîëüøå òåêóùåãî èëè ðàâåí 0");

       Alert("TimeFrame should be higher than current TF or =0");
       deinit();
       return(0);
     }
  }
//---- indicators
   SetIndexStyle(0,DRAW_HISTOGRAM,0,0);
   SetIndexBuffer(0,B_Up);
   SetIndexStyle(1,DRAW_HISTOGRAM,0,0);
   SetIndexBuffer(1,B_Dn);
//----
   return(0);
  }
//+------------------------------------------------------------------+
//| Custom indicator deinitialization function                       |
//+------------------------------------------------------------------+
int deinit()
  {
//----

//----
   return(0);
  }
//+------------------------------------------------------------------+
//| Custom indicator iteration function                              |
//+------------------------------------------------------------------+
int start()
  {
   int    counted_bars=IndicatorCounted();
   int    limit=Bars-counted_bars-1;
   int    C_time;
   int    Bar_Shift;
   if (limit==0) return(0);
//----
   int i=0;
   while(i<limit)
   {
     C_time=Time[i];
     Bar_Shift=iBarShift(NULL,TimeFrame,C_time,false);
     B_Up[i]=iCustom(NULL,TimeFrame,Indicator,Length,Phase,0,Bar_Shift);
     B_Dn[i]=iCustom(NULL,TimeFrame,Indicator,Length,Phase,1,Bar_Shift);
     i++;
   }


//----
   return(0);
  }
//+------------------------------------------------------------------+
Comments