MA_separation_P
Download script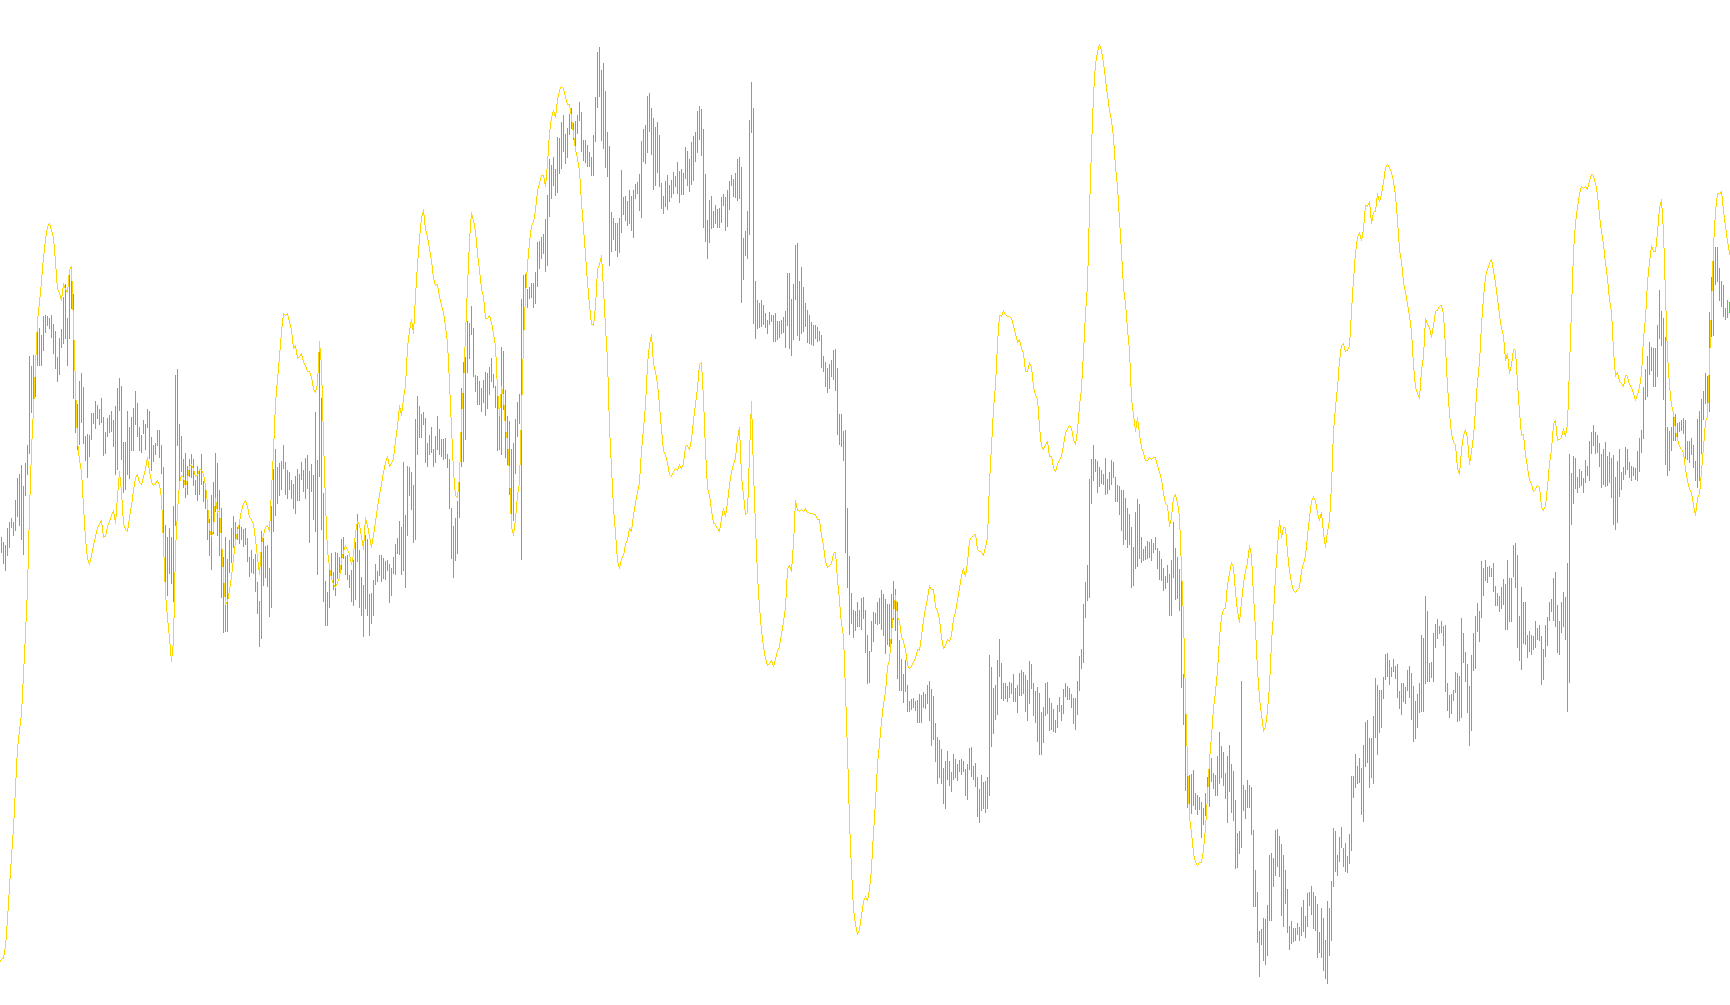
This tool is designed to help traders visualize the relationship between two different moving averages on a price chart. Instead of looking at the price movement itself, it focuses on the "gap" or distance between these two trend indicators, providing a clearer picture of market momentum and volatility.
How the Logic Works
The script functions by calculating two distinct moving averages simultaneously:
- Short-Term Trend: A fast-moving average that reacts quickly to recent price changes.
- Long-Term Trend: A slower-moving average that reflects the broader, more established direction of the market.
The core logic of the script is to subtract the value of the long-term moving average from the short-term moving average at every point in time. By calculating this difference and converting it into a standard unit (points), the tool creates a dedicated visual line in a separate window below your main chart.
Key Features and Visual Aids
- The Separation Line: The primary output is a green line that fluctuates based on the distance between the two moving averages. When the line moves upward, it indicates that the short-term price trend is pulling away from the long-term average (increasing bullish momentum). When it moves downward, it shows the short-term price is dropping relative to the long-term trend (increasing bearish momentum).
- Reference Levels: The tool includes pre-set horizontal red dotted lines at the 8 and -8 levels. These serve as visual boundaries. They help traders identify significant "separation points" where the gap between trends becomes stretched, which can often signal that a trend is becoming overextended or reaching a point of potential exhaustion.
- Customizable Parameters: The tool allows you to define exactly which moving averages are being compared by adjusting the periods (how much history the average looks at) and the calculation modes (the mathematical method used to smooth the price).
Summary for Traders
Essentially, this script removes the "noise" of the price candles and isolates the expansion and contraction of market trends. It allows you to see how aggressively the current price is moving compared to its historical average, making it easier to identify when a trend is gaining strength or beginning to lose steam.
//http://www.kroufr.ru/forum/index.php/topic,7500.0.html#msg47579
//separation [quote =alexav link=topic=7500.msg47579#msg47579 date=1219499958]

#property indicator_separate_window
#property indicator_buffers 1
#property indicator_color1 Green
#property indicator_levelcolor Red
#property indicator_levelstyle STYLE_DOT
#property indicator_level1 8
#property indicator_level2 -8
//#property indicator_minimum -20
//#property indicator_maximum 20

//---- buffers
double IND[];
extern int MAPeriod1=10;
extern int Mode1=1;
extern int Price1=0;

extern int MAPeriod2=24;
extern int Mode2=1;
extern int Price2=0;

//+------------------------------------------------------------------+
//| Custom indicator initialization function                         |
//+------------------------------------------------------------------+
int init()
  {
//---- indicators
   IndicatorShortName("MA("+MAPeriod1+","+MAPeriod2+") Separation Points:");
   SetIndexStyle(0,DRAW_LINE);
   SetIndexBuffer(0,IND);
//----

   return(0);
  }
//+------------------------------------------------------------------+
//| Custom indicator deinitialization function                       |
//+------------------------------------------------------------------+
int deinit()
  {
   return(0);
  }
//+------------------------------------------------------------------+
//| Custom indicator iteration function                              |
//+------------------------------------------------------------------+
int start()
  {
     int limit;
     int counted_bars=IndicatorCounted();
     if(counted_bars<0) return(-1);
     if(counted_bars>0) counted_bars--;
     limit=Bars-counted_bars;


     for(int i=0; i<limit; i++)
       {
        IND[i]=(iMA(NULL,0,MAPeriod1,0,Mode1,Price1,i)-iMA(NULL,0,MAPeriod2,0,Mode2,Price2,i))*1/Point;
       }
  //----
    return(0);
  }
//+------------------------------------------------------------------+
Comments