!MoneyLine2
Download script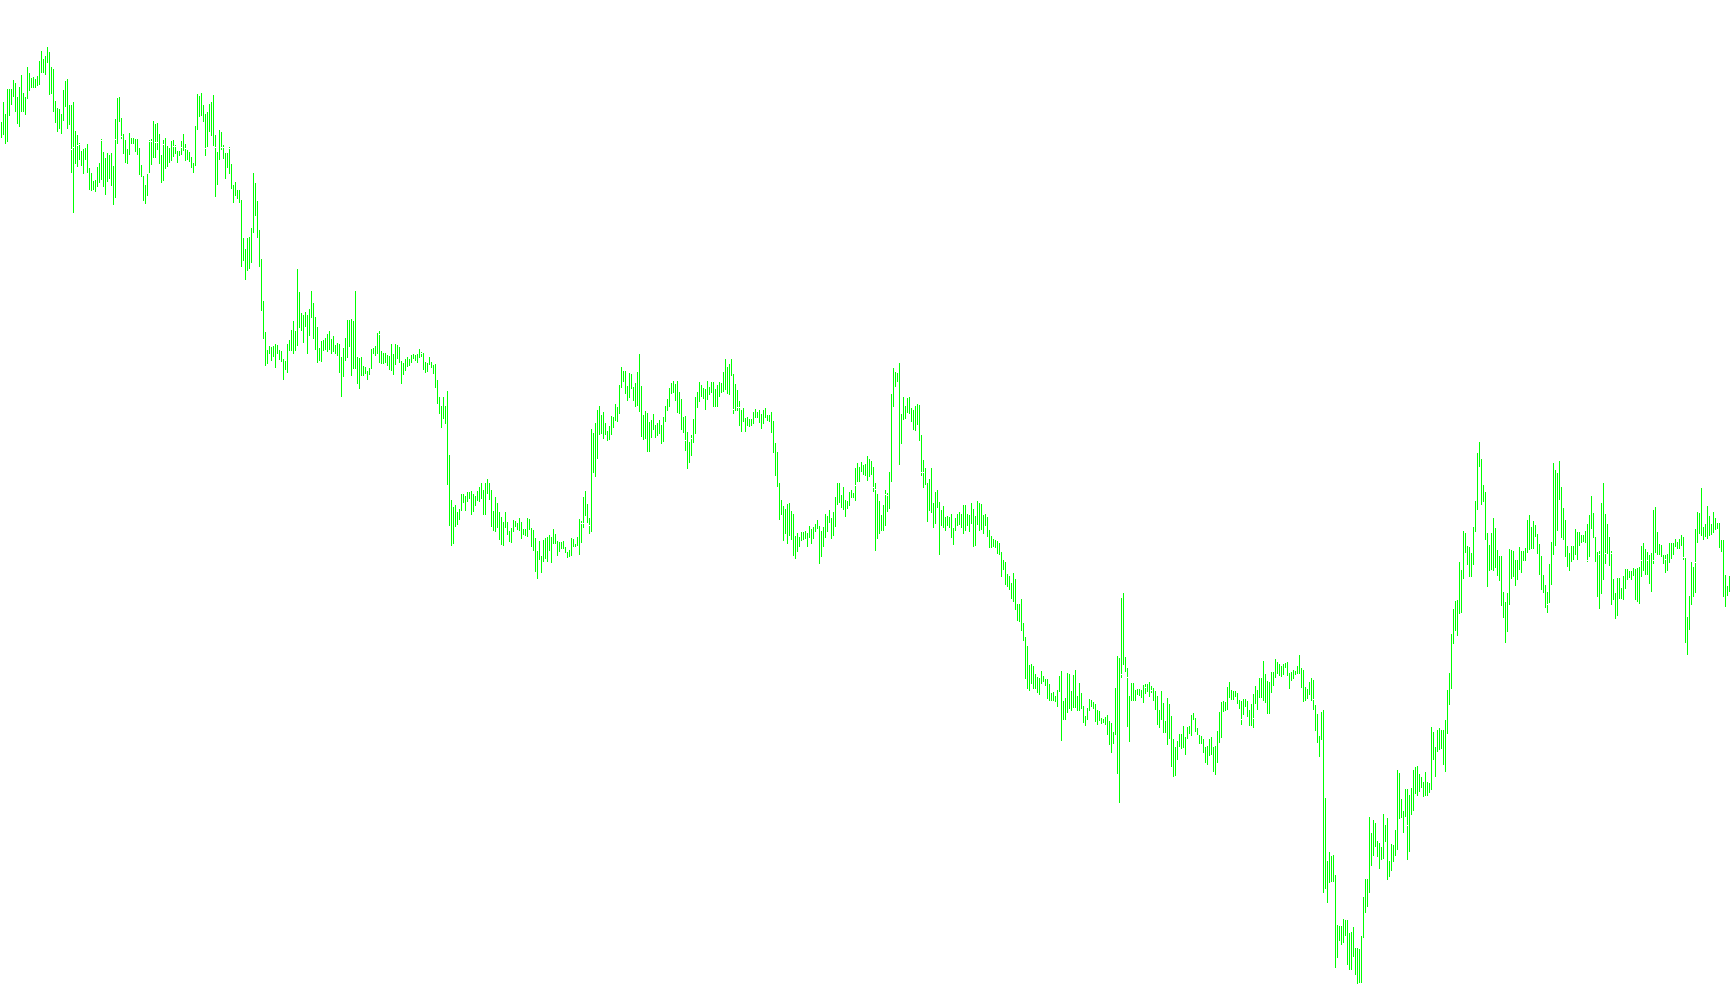
This tool is designed to serve as a visual aid on your trading chart, providing a smoothed representation of price movement to help identify trends more clearly. By filtering out minor price fluctuations, it allows you to see the broader direction of the market.
How the Logic Works
The script functions by calculating a specific type of moving average based on historical price data. Here is a breakdown of the logic in simple terms:
- Data Input: The tool looks at the "Closing Price" of candles—this is the price at which a trade was finalized for each period.
- Smoothing Mechanism: It utilizes a "Linear Weighted Moving Average." Unlike a standard average where every day carries equal weight, this method gives more importance to the most recent prices. This makes the resulting line more responsive to current market shifts while still maintaining a smooth appearance.
- Time Horizon: The calculation looks back at a window of 89 periods. By averaging this specific amount of data, the script creates a baseline that reflects a medium-term trend rather than reacting impulsively to every tiny tick in price.
- Visual Output: The result is plotted on your chart as a white dotted line. As new price data enters the market, the tool constantly recalculates the average to ensure the line moves in sync with the evolving market trend.
Summary for Traders
Essentially, this script acts as a "trend tracker." Because it weights recent prices more heavily, it attempts to stay as close to the current market sentiment as possible while smoothing out the "noise" of erratic price jumps. It provides a steady visual reference point to help you determine whether the overall momentum is leaning in one direction or another.
/*
   Generated by EX4-TO-MQ4 decompiler V4.0.224.1 []
   Website: http://purebeam.biz
   E-mail : purebeam@gmail.com
*/

#property indicator_chart_window
#property indicator_buffers 1
#property indicator_color1 White

double g_ibuf_76[];

int init() {
   IndicatorShortName("MoneyLine v1.2");
   SetIndexBuffer(0, g_ibuf_76);
   SetIndexLabel(0, "Yellow Bar v1.2");
   SetIndexDrawBegin(0, 1);
   SetIndexStyle(0, DRAW_LINE, STYLE_DOT, 1, White);
   return (0);
}

int deinit() {
   return (0);
}

int start() {
   int li_4 = IndicatorCounted();
   if (li_4 < 0) return (-1);
   if (li_4 > 0) li_4--;
   int li_0 = Bars - li_4;
   for (int li_8 = 0; li_8 < li_0; li_8++) g_ibuf_76[li_8] = iMA(NULL, 0, 89, 0, MODE_LWMA, PRICE_CLOSE, li_8);
   return (0);
}
Comments