SafeZone
Download script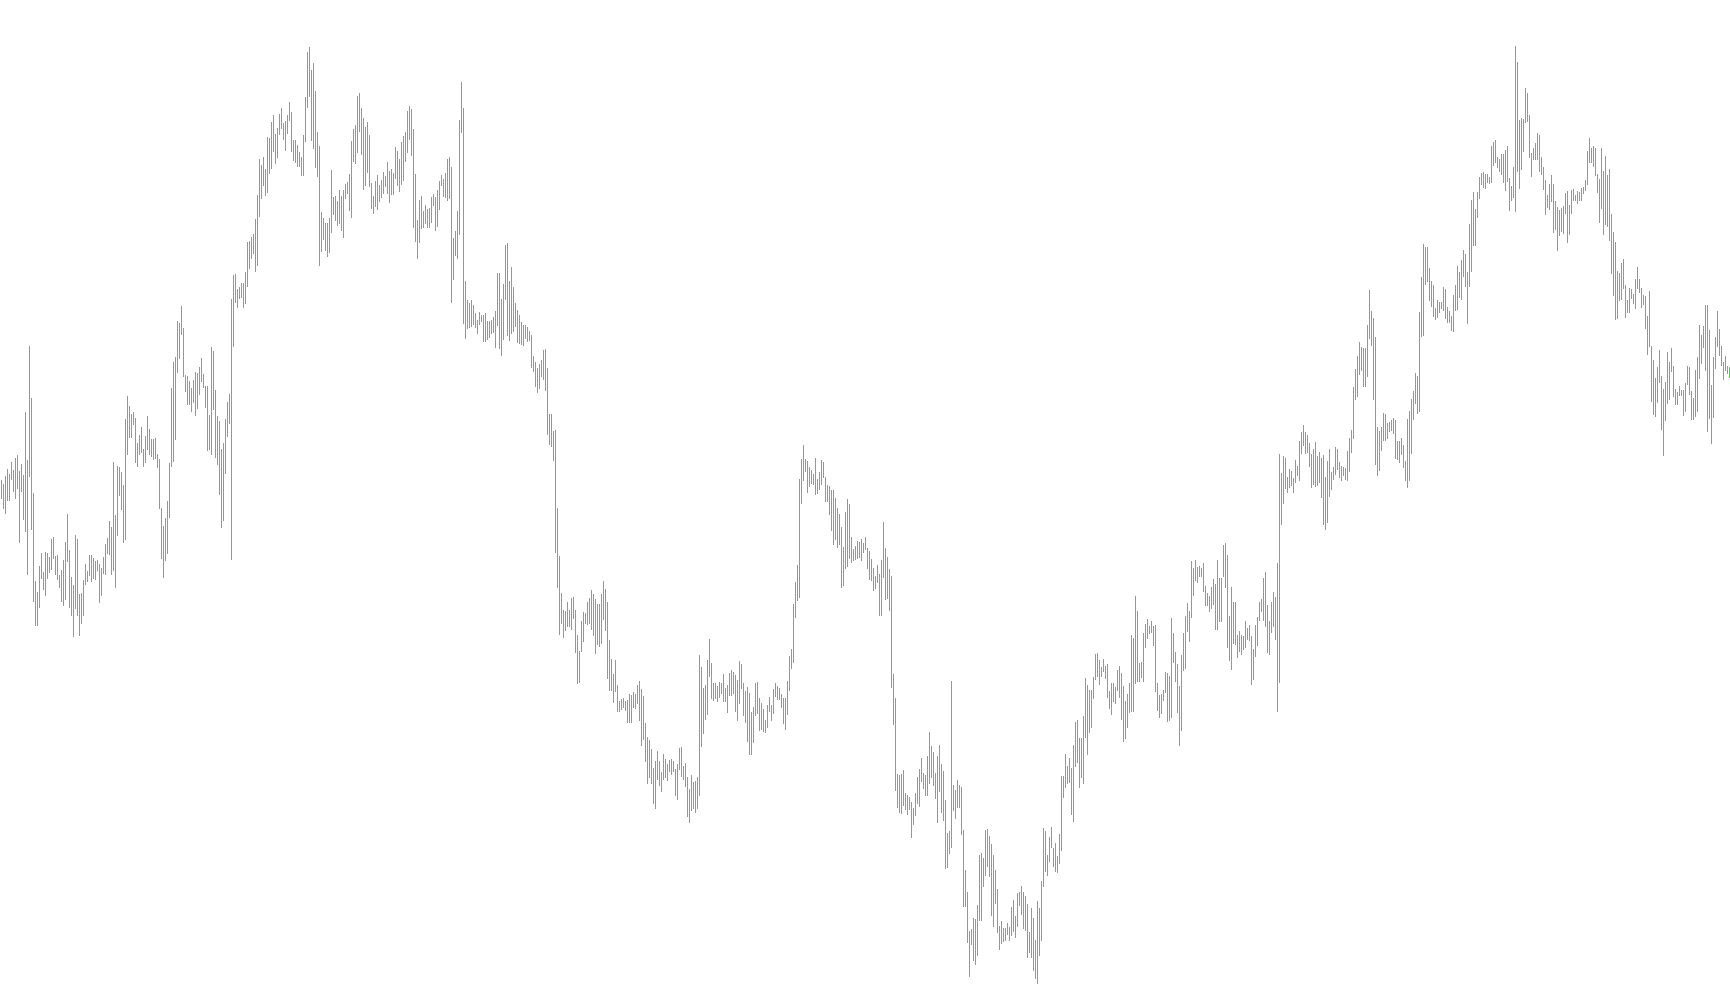
This technical indicator is designed to provide visual guidance on price action by identifying potential structural boundaries on a trading chart. It operates by analyzing historical price movement to project specific levels that can help traders understand the current market "ceiling" and "floor."
Core Logic Overview
The tool functions by examining a specific window of past price data (defined by the user as a lookback period). Rather than simply looking at the highest or lowest points, it measures the intensity of price movement. It calculates the average positive change in high prices and the average downward movement in low prices over that period.
How it Calculates the Levels
To determine where to place the indicators on your chart, the script follows these logical steps:
- Volatility Measurement: It calculates the average "jump" in price for both upward and downward movements. By using an average rather than a single peak, the tool filters out minor market noise and focuses on consistent trends.
- Projection: Once these averages are calculated, the script applies a multiplier to them. This projects a distance away from the current price, creating a theoretical boundary based on the asset's recent volatility.
- Boundary Establishment: The script then establishes two distinct lines (represented in red dots):
- The Upper Boundary: This identifies a resistance level. If the previous calculated level was already above the current high, it keeps the lower of the two values; otherwise, it sets the new projected high as the boundary.
- The Lower Boundary: This identifies a support level. If the previous level was already below the current low, it keeps the higher of the two values; otherwise, it sets the new projected low as the boundary.
Visual Behavior on the Chart
The result is a pair of dynamic, dotted red lines that track the price action. Because the logic includes "memory"—meaning it compares current projections against previous ones—the lines do not jump erratically. Instead, they create a smoothed, trailing effect that adapts to the market's rhythm.
For a trader, these lines serve as visual markers for potential areas of interest where price might encounter resistance or find support, based entirely on the mathematical behavior of the preceding bars.
#property  indicator_chart_window
#property  indicator_buffers 2
#property  indicator_color1  Red
#property  indicator_color2  Red
extern int LookbackPeriod = 12;
extern double Multiplicator =2;
double     buffer1[];
double     buffer2[];

int init()
{
   SetIndexBuffer(0, buffer1);
   SetIndexBuffer(1, buffer2);
   SetIndexStyle(0, DRAW_LINE, STYLE_DOT, 1, Red);
   SetIndexStyle(1, DRAW_LINE, STYLE_DOT, 1, Red);
   return(0);
}

int start()
{
  int limit;
  int counted_bars = IndicatorCounted();
  if (counted_bars < 0) return(-1);
  if (counted_bars > 0) counted_bars--;
  limit = Bars - counted_bars - 1;
  for(int i = limit; i >= 0; i--)
  {
    double h = 0;
    int hc = 0;
    double l = 0;
    int lc = 0;
    for (int j = 1; j <= LookbackPeriod; j++)
    {
      double dh = High[i + j] - High[i + j + 1];
      if (dh > 0)
      {
        h += dh;
        hc++;
      }
      double dl = Low[i + j + 1] - Low[i + j];
      if (dl > 0)
      {
        l += dl;
        lc++;
      }
    }
    if (hc > 0) h = h / hc;
    if (lc > 0) l = l / lc;
    h = High[i + 1] + h * Multiplicator;
    l = Low[i + 1] - l * Multiplicator;
    if (buffer1[i + 1] > High[i + 1])
    {
      buffer1[i] = MathMin(h, buffer1[i + 1]);
    }
    else
    {
      buffer1[i] = h;
    }
    if (buffer2[i + 1] < Low[i + 1])
    {
      buffer2[i] = MathMax(l, buffer2[i + 1]);
    }
    else
    {
      buffer2[i] = l;
    }
  }
  return(0);
}
Comments