SilverTrend_Signal_v2
Download script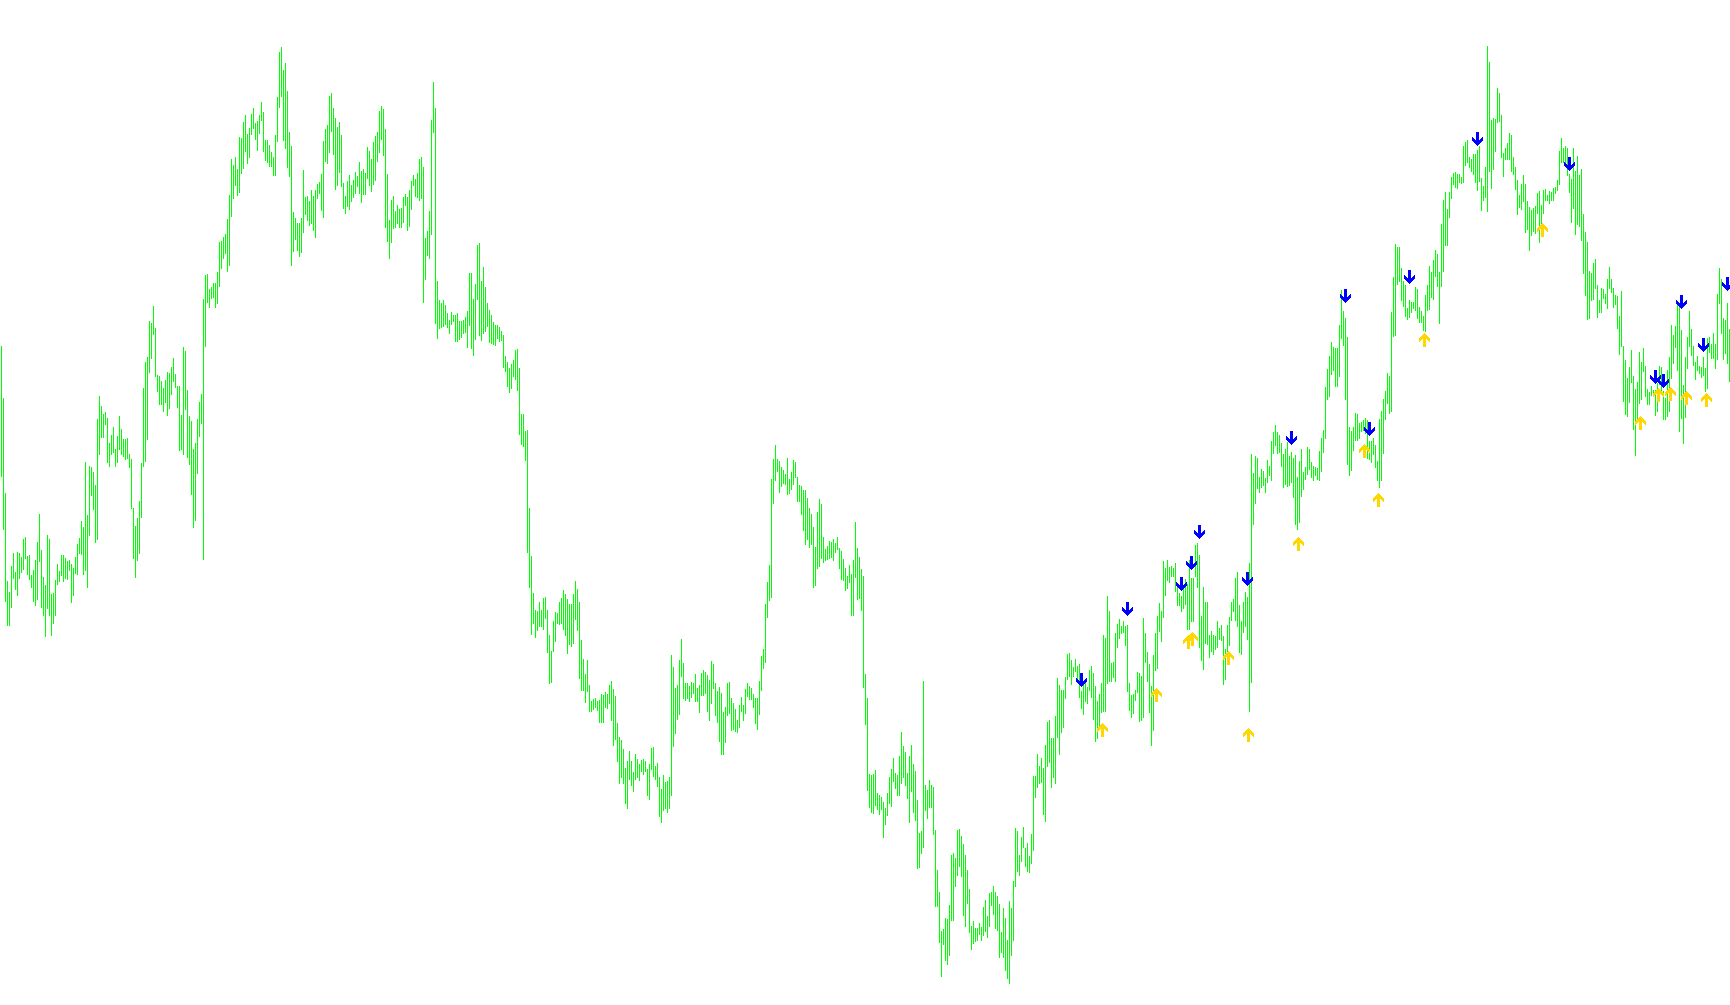
This tool is designed to identify and visualize trend reversals on a trading chart by analyzing price action patterns. Instead of simply following every small fluctuation, the logic focuses on identifying significant structural shifts in momentum to provide clear entry or exit signals.
Core Logic & Functionality
Price Range Analysis The script begins by calculating the "volatility" of the market over a specific look-back period (defined by the user). It measures the average size of the candles (the distance between the highest and lowest points) to understand the current intensity of the price movement. This ensures that the signals generated are proportional to the current market environment.
Dynamic Threshold Calculation The indicator establishes a "buffer zone" based on recent highs and lows. It calculates a maximum and minimum price point over a set window and then applies a percentage-based offset (determined by the Risk parameter). This creates two dynamic thresholds:
- A lower boundary that price must break above to confirm upward momentum.
- An upper boundary that price must break below to confirm downward momentum.
Trend Detection & Signal Generation The script constantly monitors whether the current closing price has breached these dynamic thresholds. It is designed to detect a "state change"—meaning it only triggers a signal at the exact moment the trend flips from bullish to bearish (or vice versa).
- Bullish Signal: When the price closes decisively above the upper threshold after being in a downward state, the script places an upward-pointing arrow below the candle.
- Bearish Signal: When the price closes decisively below the lower threshold after being in an upward state, the script places a downward-pointing arrow above the candle.
Summary for the User
In simple terms, this tool filters out "market noise" by looking for confirmed breakouts. It identifies when the price has moved enough to suggest a new direction is forming and marks those specific moments on your chart with visual arrows, helping you spot potential turning points in the market trend.
/*-----------------------------+
|			       |
| Shared by www.Aptrafx.com    |
|			       |
+------------------------------*/

//+------------------------------------------------------------------+
//| SilverTrend_Signal.mq4
//| Ramdass - Conversion only
//+------------------------------------------------------------------+
#property copyright "SilverTrend  rewritten by CrazyChart"
#property link      "http://viac.ru/"

#property indicator_chart_window
#property indicator_buffers 2
#property indicator_color1 Aqua
#property indicator_color2 Violet

//---- input parameters
extern int RISK=3;
extern int CountBars=350;
extern int SSP=9;

//---- buffers
double val1[];
double val2[];

//+------------------------------------------------------------------+
//| Custom indicator initialization function                         |
//+------------------------------------------------------------------+
int init()
  {
   string short_name;
//---- indicator line
   IndicatorBuffers(2);
   SetIndexStyle(0,DRAW_ARROW);
   SetIndexArrow(0,233);
   SetIndexStyle(1,DRAW_ARROW);
   SetIndexArrow(1,234);
   SetIndexBuffer(0,val1);
   SetIndexBuffer(1,val2);
//----
   return(0);
  }
//+------------------------------------------------------------------+
//| SilverTrend_Signal                                               |
//+------------------------------------------------------------------+
int start()
  {
   if (CountBars>=Bars) CountBars=Bars;
   SetIndexDrawBegin(0,Bars-CountBars+SSP);
   SetIndexDrawBegin(1,Bars-CountBars+SSP);
   int i,shift,counted_bars=IndicatorCounted();
   int i1,i2,K;
   double Range,AvgRange,smin,smax,SsMax,SsMin,price;
   bool uptrend,old;
//----

   if(Bars<=SSP+1) return(0);
//---- initial zero
   if(counted_bars<SSP+1)
   {
      for(i=1;i<=SSP;i++) val1[CountBars-i]=0.0;
      for(i=1;i<=SSP;i++) val2[CountBars-i]=0.0;
   }
//----

K=33-RISK;
for (shift = CountBars-SSP; shift>=0; shift--)
{

	Range=0;
	AvgRange=0;
	for (i1=shift; i1<=shift+SSP; i1++)
		{AvgRange=AvgRange+MathAbs(High[i1]-Low[i1]);
		}
	Range=AvgRange/(SSP+1);

SsMax=High[shift]; SsMin=Low[shift];
   for (i2=shift;i2<=shift+SSP-1;i2++)
        {
         price=High[i2];
         if(SsMax<price) SsMax=price;
         price=Low[i2];
         if(SsMin>=price)  SsMin=price;
        }

smin = SsMin+(SsMax-SsMin)*K/100;
smax = SsMax-(SsMax-SsMin)*K/100;
	val1[shift]=0;
	val2[shift]=0;
	if (Close[shift]<smin)
		{
		uptrend = false;
		}
	if (Close[shift]>smax)
		{
		uptrend = true;
		}
   if (uptrend!=old && uptrend==true) {val1[shift]=Low[shift]-Range*0.5;}
   if (uptrend!=old && uptrend==false) {val2[shift]=High[shift]+Range*0.5;}
   old=uptrend;

}
   return(0);
  }
//+------------------------------------------------------------------+
Comments