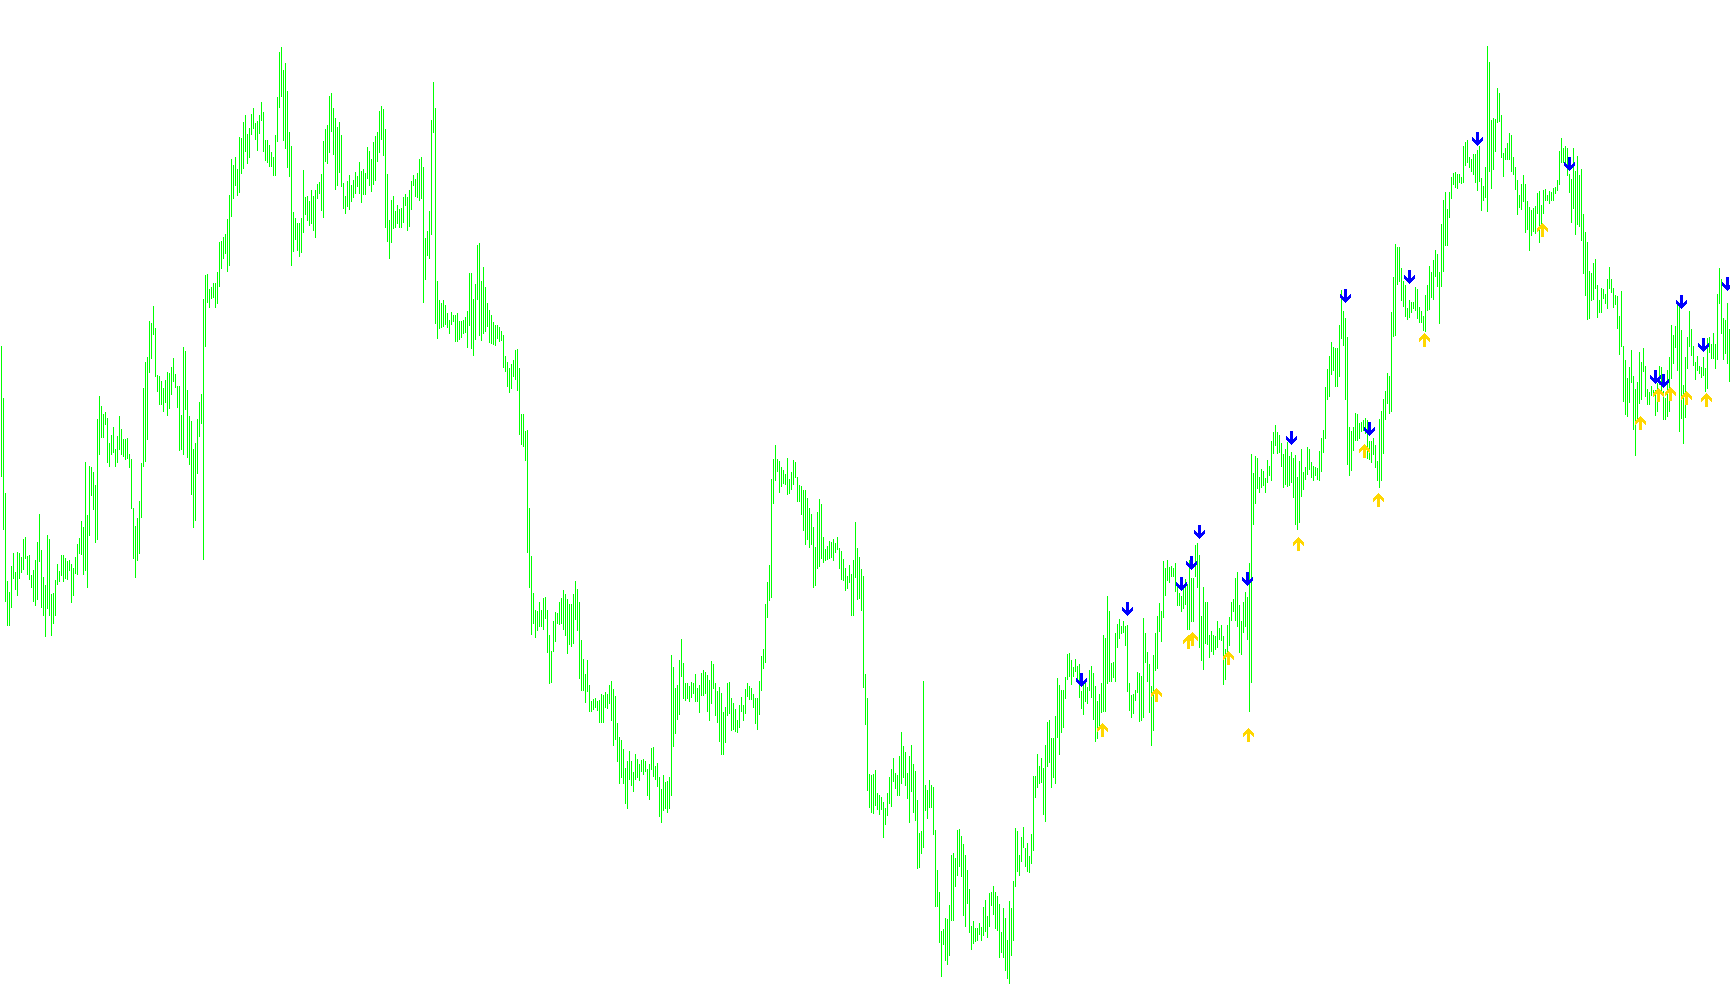
This script is designed to act as a visual trend-tracking tool for traders. Its primary purpose is to identify clear shifts in market momentum by analyzing price action history and marking specific "flip" points where the trend changes direction.
How the Logic Works
1. Analyzing Market Volatility The tool begins by looking at a specific window of recent price bars. It calculates the "Average Range," which is essentially measuring how much the price fluctuates (the distance between the highest and lowest points) during that period. This helps the script understand the current "personality" of the market—whether it is moving in small, tight steps or large, volatile swings.
2. Establishing Dynamic Boundaries Instead of using a fixed line, the script creates a dynamic "buffer zone" based on the highest highs and lowest lows of the recent price history. It calculates a percentage-based threshold (determined by the Risk parameter). Think of this as creating a "no-man's land" or a neutral zone between the top and bottom of recent price action:
- A Lower Boundary is established based on the recent low.
- An Upper Boundary is established based on the recent high.
3. Identifying Trend Shifts The script constantly monitors where the current closing price sits in relation to these boundaries:
- Bullish Shift: If the price closes significantly above the Upper Boundary, the tool recognizes a shift into an "Uptrend."
- Bearish Shift: If the price closes significantly below the Lower Boundary, the tool recognizes a shift into a "Downtrend."
4. Visual Signaling The script does not clutter your chart with constant lines. Instead, it only places a visual marker (an arrow) at the exact moment the trend state changes.
- When the market flips from a downtrend to an uptrend, a Blue signal appears below the price.
- When the market flips from an uptrend to a downtrend, a Red signal appears above the price.
Summary for the User
Essentially, this tool filters out "market noise." Rather than reacting to every small tick of price movement, it waits for the price to break out of a calculated range of historical highs and lows. When that breakout happens, it signals a change in the prevailing trend, helping you visualize where the momentum has officially shifted from one direction to another.
//+------------------------------------------------------------------+
//| SilverTrend_Signal.mq4
//| Ramdass - Conversion only
//+------------------------------------------------------------------+
#property copyright "SilverTrend  rewritten by CrazyChart"
#property link      "http://viac.ru/"

#property indicator_chart_window
#property indicator_buffers 2
#property indicator_color1 Blue
#property indicator_color2 Red

//---- input parameters
extern int RISK=3;
extern int CountBars=350;
int SSP=9;

//---- buffers
double val1[];
double val2[];

//+------------------------------------------------------------------+
//| Custom indicator initialization function                         |
//+------------------------------------------------------------------+
int init()
  {
   string short_name;
//---- indicator line
   IndicatorBuffers(2);
   SetIndexStyle(0,DRAW_ARROW);
   SetIndexArrow(0,233);
   SetIndexStyle(1,DRAW_ARROW);
   SetIndexArrow(1,234);
   SetIndexBuffer(0,val1);
   SetIndexBuffer(1,val2);
//----
   return(0);
  }
//+------------------------------------------------------------------+
//| SilverTrend_Signal                                               |
//+------------------------------------------------------------------+
int start()
  {
   if (CountBars>=Bars) CountBars=Bars;
   SetIndexDrawBegin(0,Bars-CountBars+SSP);
   SetIndexDrawBegin(1,Bars-CountBars+SSP);
   int i,shift,counted_bars=IndicatorCounted();
   int i1,i2,K;
   double Range,AvgRange,smin,smax,SsMax,SsMin,price;
   bool uptrend,old;
//----

   if(Bars<=SSP+1) return(0);
//---- initial zero
   if(counted_bars<SSP+1)
   {
      for(i=1;i<=SSP;i++) val1[CountBars-i]=0.0;
      for(i=1;i<=SSP;i++) val2[CountBars-i]=0.0;
   }
//----

K=33-RISK;
for (shift = CountBars-SSP; shift>=0; shift--)
{

	Range=0;
	AvgRange=0;
	for (i1=shift; i1<=shift+SSP; i1++)
		{AvgRange=AvgRange+MathAbs(High[i1]-Low[i1]);
		}
	Range=AvgRange/(SSP+1);

SsMax=High[shift]; SsMin=Low[shift];
   for (i2=shift;i2<=shift+SSP-1;i2++)
        {
         price=High[i2];
         if(SsMax<price) SsMax=price;
         price=Low[i2];
         if(SsMin>=price)  SsMin=price;
        }

smin = SsMin+(SsMax-SsMin)*K/100;
smax = SsMax-(SsMax-SsMin)*K/100;
	val1[shift]=0;
	val2[shift]=0;
	if (Close[shift]<smin)
		{
		uptrend = false;
		}
	if (Close[shift]>smax)
		{
		uptrend = true;
		}
   if (uptrend!=old && uptrend==true)
      {
      val1[shift]=Low[shift]-Range*0.5;
      }
   if (uptrend!=old && uptrend==false)
      {
      val2[shift]=High[shift]+Range*0.5;
      }
   old=uptrend;

}
   return(0);
  }
//+------------------------------------------------------------------+
Comments