[i] AltrTrend
Download script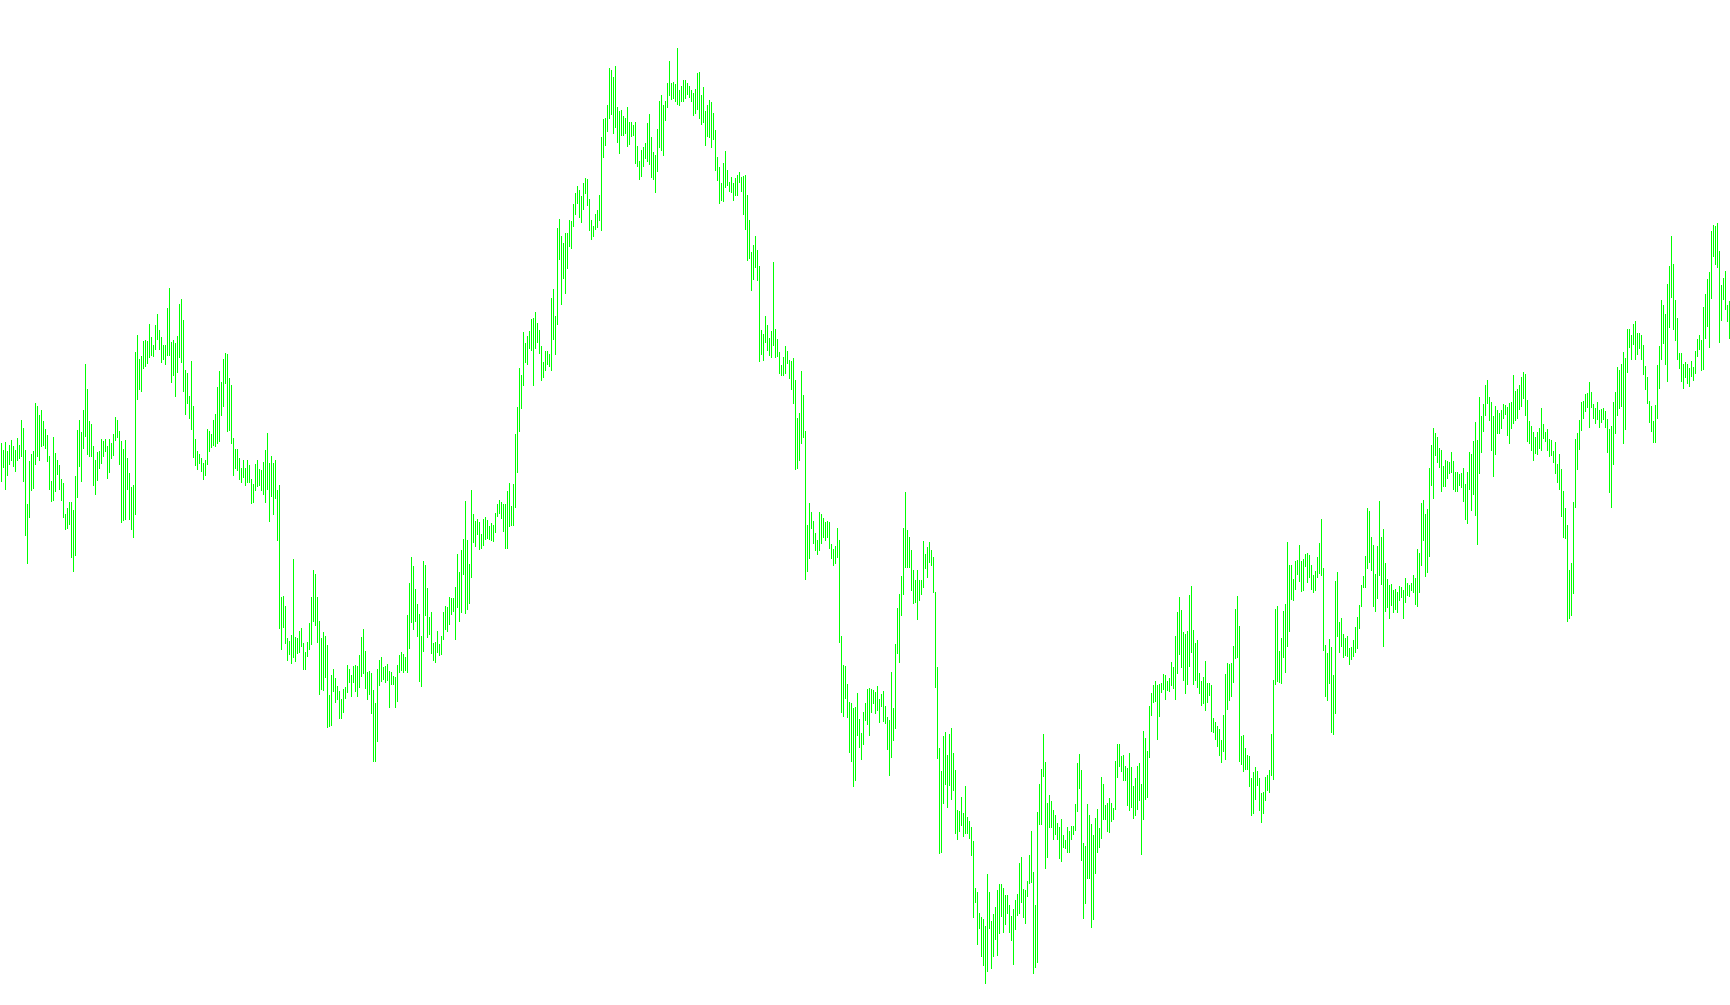
The AltrTrend tool is a visual market analysis indicator designed to help traders identify the underlying trend and price direction by filtering out "market noise." Instead of simply following every small price movement, it uses a multi-layered calculation logic to determine whether the current price action is trending strongly enough to be significant.
How the Logic Works
The script operates by analyzing the relationship between three primary factors: market volatility, historical price ranges, and relative price positioning. Here is a breakdown of the process:
1. Dynamic Trend Strength Measurement The tool first looks at the market's current momentum using a standard strength indicator (ADX). It uses this data to calculate a "look-back" period. This means the indicator automatically adjusts how much historical data it needs to examine based on how volatile or stable the market is currently behaving. If the market is moving very quickly, the tool focuses on a different window of time than if the market is moving slowly.
2. Identifying Significant Price Ranges Once the look-back period is established, the script scans that timeframe to find the highest and lowest price points reached. It then calculates the average size of the price candles within that period. By doing this, the indicator understands the "normal" behavior of the market for that specific moment in time.
3. Defining Support and Resistance Zones Using the highest and lowest prices found in the previous step, the tool establishes a mathematical "buffer zone." It calculates a percentage-based threshold (controlled by the K-parameter) to determine the boundaries of the current trend. This helps distinguish between minor price fluctuations and meaningful shifts in direction.
4. Visual Trend Identification The final step is the visual output on your chart. The indicator evaluates where the current closing price sits in relation to those calculated boundaries:
- If the price closes significantly below the established lower boundary, it indicates a downward trend strength.
- If the price closes significantly above the established upper boundary, it indicates an upward trend strength.
Summary for the User
Essentially, AltrTrend acts as a filter. It looks at how far the price has moved relative to its recent history and only "signals" a trend when the price breaks out of a statistically significant range. This helps traders avoid getting caught in "choppy" sideways markets by highlighting moments where the price is showing clear directional intent.
/*-----------------------------+
|			       |
| Shared by www.Aptrafx.com    |
|			       |
+------------------------------*/

//+------------------------------------------------------------------+
//| AltrTrend.mq4
//| Ramdass - Conversion only
//+------------------------------------------------------------------+
#property  copyright "Author - OlegVS, GOODMAN"

#property indicator_chart_window
#property indicator_buffers 2
#property indicator_color1 Green
#property indicator_color2 Crimson


//---- input parameters
extern int K=30;
extern double Kstop=0.5;
extern int Kperiod=150;
extern int PerADX=14;
extern int CountBars=350;

//---- buffers
double val1[];
double val2[];

//+------------------------------------------------------------------+
//| Custom indicator initialization function                         |
//+------------------------------------------------------------------+
int init()
  {
   string short_name;
//---- indicator line
   IndicatorBuffers(4);
   SetIndexStyle(0,DRAW_HISTOGRAM,0,2);
   SetIndexStyle(1,DRAW_HISTOGRAM,0,2);
   SetIndexStyle(2,DRAW_HISTOGRAM,0,2);
   SetIndexStyle(3,DRAW_HISTOGRAM,0,2);
   SetIndexBuffer(0,val1);
   SetIndexBuffer(1,val2);
//----
   return(0);
  }
//+------------------------------------------------------------------+
//| AltrTrend                                                        |
//+------------------------------------------------------------------+
int start()
  {
   if (CountBars>=Bars) CountBars=Bars;
   SetIndexDrawBegin(0,Bars-CountBars+PerADX);
   SetIndexDrawBegin(1,Bars-CountBars+PerADX);
   int i,shift,counted_bars=IndicatorCounted();
   int i1,i2,x1=70,x2=30;
   double Range,AvgRange,smin,smax,SsMax,SsMin,SSP,price;
//----
   if(Bars<=PerADX+1) return(0);
//---- initial zero
   if(counted_bars<SSP+1)
   {
      for(i=1;i<=PerADX;i++) val1[CountBars-i]=0.0;
      for(i=1;i<=PerADX;i++) val2[CountBars-i]=0.0;
   }
//----


for (shift = CountBars-PerADX; shift>=0; shift--)
{

SSP=MathCeil(Kperiod/iADX(NULL,0,PerADX,PRICE_CLOSE,MODE_MAIN,1));
	Range=0;
	AvgRange=0;
	for (i1=shift; i1<=shift+SSP; i1++)
		{AvgRange=AvgRange+MathAbs(High[i1]-Low[i1]);
		}
	Range=AvgRange/(SSP+1);

SsMax=High[shift]; SsMin=Low[shift];
   for (i2=shift;i2<=shift+SSP-1;i2++)
        {
         price=High[i2];
         if(SsMax<price) SsMax=price;
         price=Low[i2];
         if(SsMin>=price)  SsMin=price;
        }

smin = SsMin+(SsMax-SsMin)*K/100;
smax = SsMax-(SsMax-SsMin)*K/100;
	val1[shift]=0;
	val2[shift]=0;
	if (Close[shift]<smin)
		{
		val1[shift]=Low[shift]; val2[shift]=High[shift];
		}
	if (Close[shift]>smax)
		{
		val1[shift]=High[shift]; val2[shift]=Low[shift];
		}

}
   return(0);
  }
//+------------------------------------------------------------------+
Comments