dpo_mtf
Download script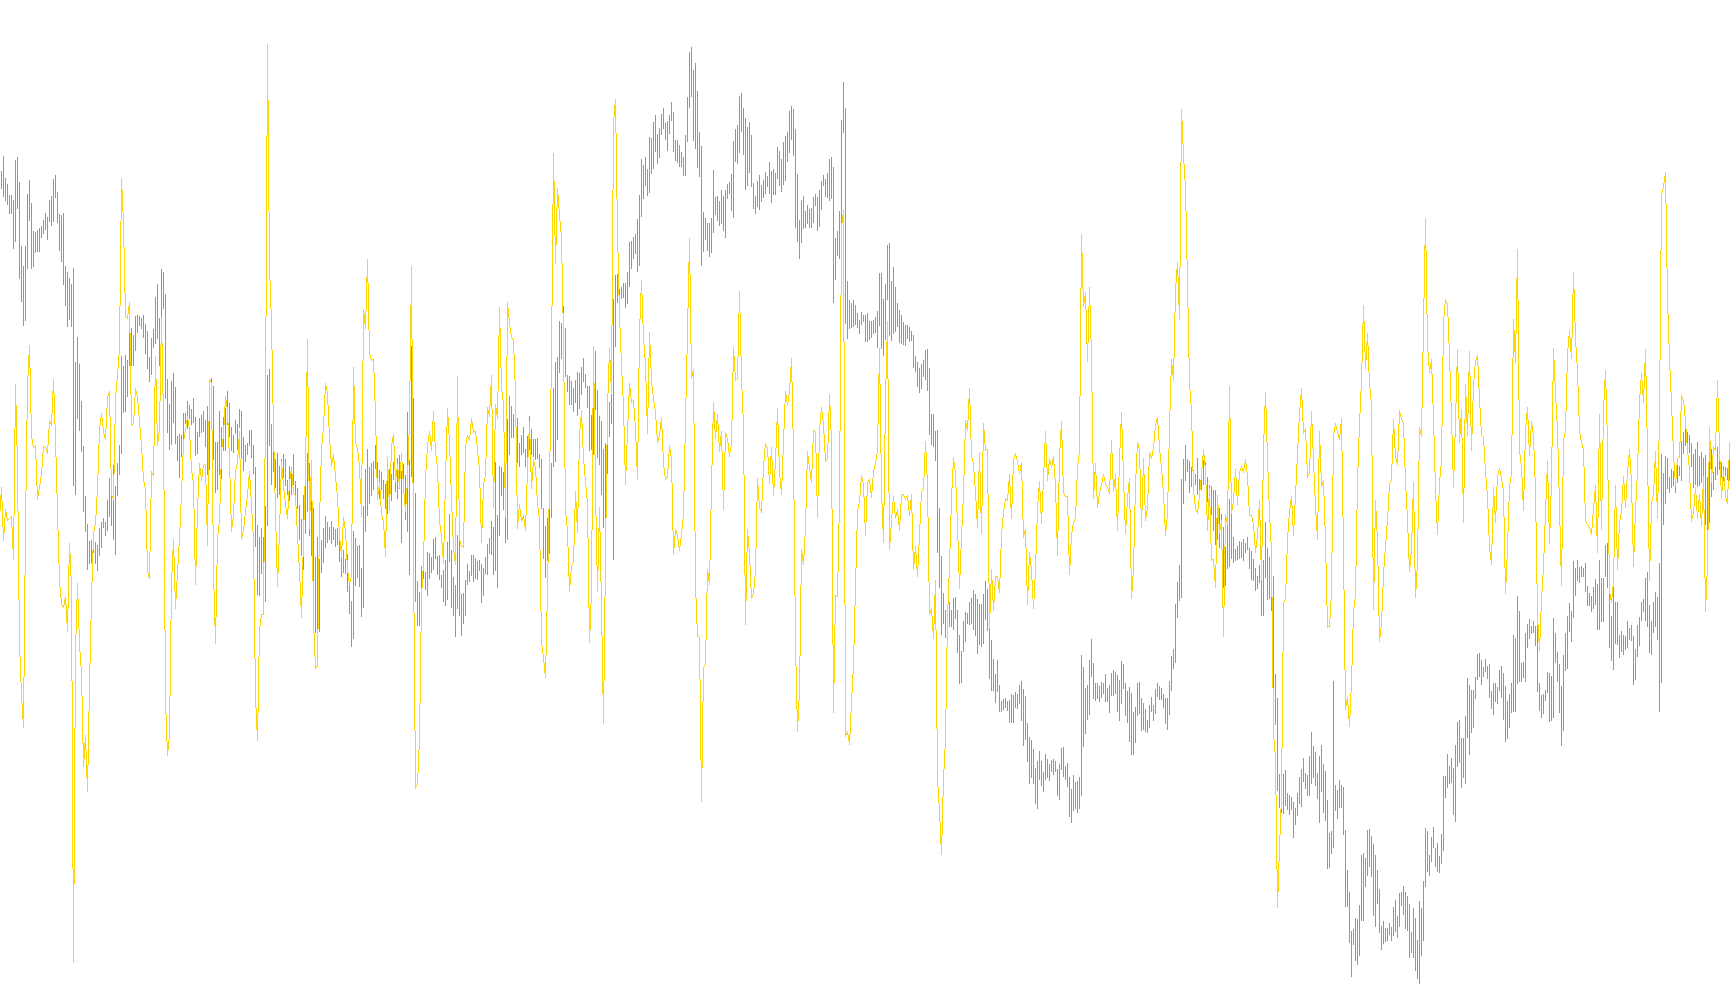
This tool is designed to provide traders with a specialized visual analysis of price momentum by comparing two different moving average calculations across multiple timeframes. Its primary purpose is to identify trends and potential reversals by measuring the "distance" or "gap" between a fast-moving price average and a slower, more stable one.
Core Functionality
The logic operates on three main pillars:
1. Dual Moving Average Comparison At its heart, the script calculates two distinct moving averages simultaneously. It identifies a "fast" period (intended to react quickly to recent market changes) and a "slow" period (intended to represent the broader trend). By subtracting the value of the slow average from the fast average, the tool produces a single data point that represents the current momentum.
2. Multi-Timeframe Integration A unique feature of this script is its ability to look beyond the current chart you are viewing. It can pull data from higher timeframes (such as Daily, Weekly, or Monthly charts) and project that information onto your current screen. This allows a trader to see how high-level market trends are influencing the smaller price movements they are currently watching in real-time.
3. Dynamic Scaling and Calculation The tool is highly customizable regarding how it calculates these averages. It offers various methods for smoothing the data—ranging from simple averages to weighted versions—ensuring that the user can adjust the "sensitivity" of the indicator to suit different trading styles, whether they prefer a smooth, lagging view or a sharper, more reactive signal.
How to Interpret the Logic
When the resulting value is positive, it indicates that the short-term price momentum is leading above the long-term average. When the value turns negative, it suggests the short-term momentum is falling below the long-term trend. By observing the peaks and valleys of this "gap" across different timeframes, traders can better identify when a market is overextended or beginning to shift direction.
//+------------------------------------------------------------------+
//|                              dpo_mtf.mq4                         |
//|                                                                  |
//+------------------------------------------------------------------+
//2009fxtsd

#property copyright ""
#property link      ""

#property indicator_separate_window
#property indicator_buffers    1
#property indicator_color1     Blue


extern int DPOperiod       = 7;
extern int DPOprice        = 0;
extern int DPOMAmethod     = 0;

extern int primeSmzPeriod        = 1;
extern int primeSmzMAmethod      = 1;

extern int TimeFrame=0;

extern string  MA_Method_Price = "SMA0 EMA1 SMMA2 LWMA3||0O,1C 2H3L,4Md 5Tp 6WghC: Md(HL/2)4,Tp(HLC/3)5,Wgh(HLCC/4)6";
extern string TimeFrames = "M1;5,15,30,60H1;240H4;1440D1;10080W1;43200MN|0-CurrentTF";

double buffer1[];
//+------------------------------------------------------------------+
//|                                                                  |
//+------------------------------------------------------------------+

int init()
{


   SetIndexBuffer(0,buffer1);


   if (primeSmzPeriod>1) string name =" smz ("+primeSmzPeriod+","+primeSmzMAmethod+") ";
                          else name=" ";

   TimeFrame = MathMax(TimeFrame,Period());

   IndicatorShortName("DPO "+DPOperiod+name+" M"+TimeFrame);
   SetIndexLabel(0,"DPO");


   return(0);
}
int deinit()
{
   return(0);
}

//+------------------------------------------------------------------+
//|                                                                  |
//+------------------------------------------------------------------+


int start()
{
   int counted_bars=IndicatorCounted();
   int limit,i;

   if(counted_bars<0) return(-1);
   if(counted_bars>0) counted_bars--;

            limit=Bars-counted_bars;
            if(TimeFrame!=Period())
            limit = MathMax(limit,TimeFrame/Period());


   for(i=limit; i>=0; i--)
   {

     if (primeSmzPeriod<1)primeSmzPeriod =1;
                 int y = iBarShift(NULL,TimeFrame,Time[i]);

     buffer1[i]  =   iMA(NULL, TimeFrame, primeSmzPeriod, 0, primeSmzMAmethod, DPOprice, y)-
                     iMA(NULL, TimeFrame, DPOperiod, 0, DPOMAmethod, DPOprice, y);


  }

   return(0);
}
Comments