HiLoBandsBug
Download script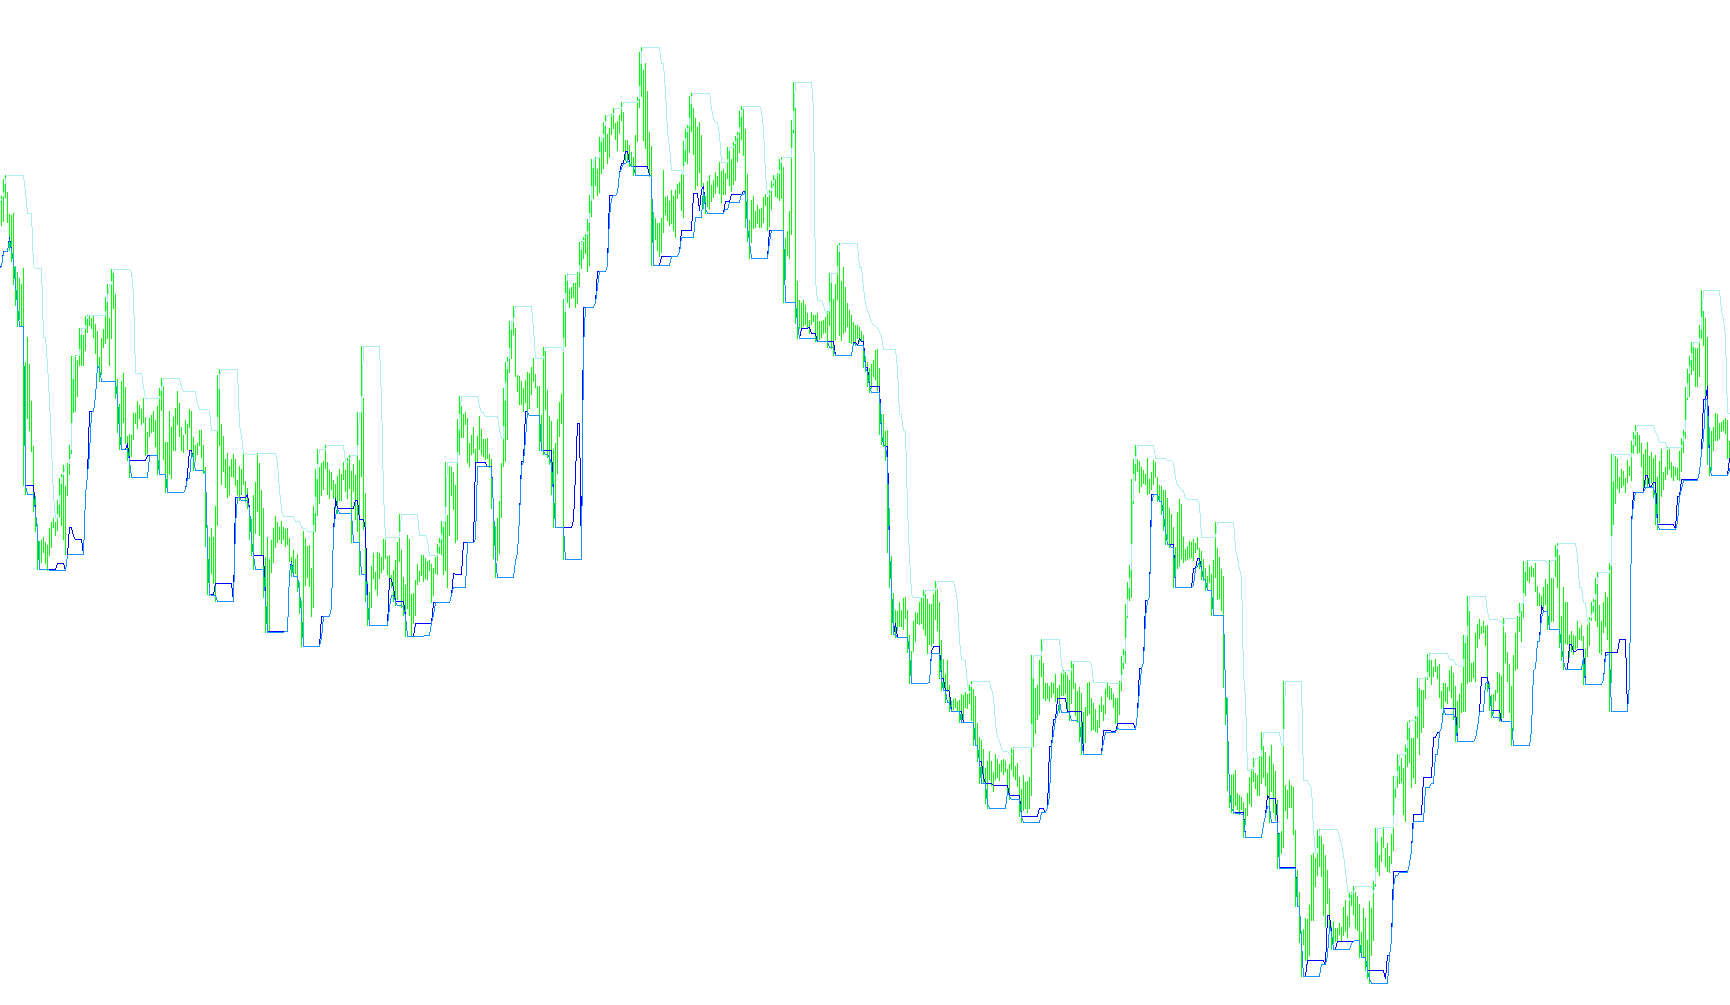
This technical indicator for the MetaTrader platform is designed to visualize price boundaries on a trading chart by identifying significant historical highs and lows. It provides traders with a visual representation of price extremes over a specific period, helping to define market structure.
Core Logic and Functionality
The script operates by scanning the historical price data of a financial asset to determine the highest and lowest points reached within a defined window. Here is a breakdown of how it processes this information:
- Dynamic Data Window: The indicator looks back at a specific number of price candles (defined by the "bandlen" setting). By focusing on a set period, it filters out minor market noise to highlight more significant price levels.
- Dual-Method Calculation: The script calculates these price boundaries using two distinct logic paths simultaneously:
- Standard High/Low Detection: It identifies the absolute highest and lowest prices reached within the designated lookback window. These are used to create primary visual lines on the chart.
- Manual Iterative Scanning: To ensure accuracy, the script performs a manual step-by-step comparison of every candle price within the lookback period. It examines each historical bar one by one, comparing the prices to find the exact extremes. This secondary calculation provides a fallback or alternative data set (labeled as "highline2" and "lowline2") to ensure the boundaries are captured correctly.
- Visual Representation: The results of these calculations are plotted on the chart as lines. These lines serve as visual "bands" or "rails," indicating where price has peaked or底 reached in the recent past.
How It Benefits the User
Instead of a trader having to manually search through hundreds of candles to find previous price peaks, this script automates that process. By plotting these highs and lows automatically, it allows users to:
- Identify potential support and resistance zones more quickly.
- Observe the volatility of the market by seeing how wide the gap between the high and low bands is over time.
- Gain a clearer perspective on "Price Action" by seeing the structural boundaries of the current market trend.
Miscellaneous
11
Views
0
Downloads
0
Favorites
HiLoBandsBug
//+------------------------------------------------------------------+
//|
//|
//+------------------------------------------------------------------+
#property copyright "HiLoBands"
#property link      ""

#property indicator_chart_window
#property indicator_buffers 5

#property indicator_color1 White
#property indicator_color2 Aqua
#property indicator_color3 Aqua
#property indicator_color4 Orange
#property indicator_color5 Orange

// THIS SHOWS A BUG WITH THE LOWER BANDS ON MY METATRADER


extern int CountBars=4000;

extern int bandlen=9;
int counter=0;
//---- buffers


double highline[],lowline[];
double highline2[],lowline2[];

//+------------------------------------------------------------------+
//| Custom indicator initialization function                         |
//+------------------------------------------------------------------+
int init()
  {
   string short_name;
//---- indicator line
   IndicatorBuffers(4);
   SetIndexStyle(0,DRAW_LINE);
   SetIndexStyle(1,DRAW_LINE);
   SetIndexBuffer(0,highline);
   SetIndexBuffer(1,lowline);
   SetIndexStyle(2,DRAW_LINE);
   SetIndexStyle(3,DRAW_LINE);
   SetIndexBuffer(2,highline2);
   SetIndexBuffer(3,lowline2);
//----
   return(0);
  }


//+------------------------------------------------------------------+
//| SilverTrend_PowerLaw                                             |
//+------------------------------------------------------------------+
int start()
  {
   CountBars = MathMin(Bars-bandlen-1,CountBars);

   int i,shift,counted_bars=IndicatorCounted();
   int i1,i2;
   int limit;
//----

//----
   if (counted_bars<0) return(-1);
   if (counted_bars>0) counted_bars--;


   limit = CountBars; // -counted_bars;
   if (limit < 1) limit = 1;
   ArrayResize(highline,limit);
   ArrayResize(lowline,limit);

   for (shift = limit; shift>=0; shift--)
   {
      double center, highweighted, lowweighted,range;

      // collect running highs and lows back in time.
      // high[k] means the highest high in the previous 'k' timesteps,
      // starting at shift.  Therefore high[k] must be monotonically increasing
      // as low[k] is monotonically decreasing.
      //
      int offset = 1;
      // for offset = 1 start computing using previous bar's data only, this may be
      // needed for causality if using a trading system
      double H1,L1;
      double H2,L2;

      H1 = High[Highest(Symbol(),0,PRICE_HIGH,bandlen,shift+offset)];
      L1 = Low[Lowest(Symbol(),0,PRICE_LOW,bandlen,shift+offset)];
      highline[shift] = H1;
      lowline[shift] = L1;
      // now do it manually
      H2 = High[shift+offset];
      L2 = Low[shift+offset];
      for (int k=1; k < bandlen; k++) {
         double HV = High[shift+k+offset];
         if (HV > H2) H2 = HV;
         //L2 = MathMin(L2,iLow(Symbol(),0,shift+k+offset));
         double LV = Low[shift+k+offset];
         if (LV < L2) L2 = LV;
      }
      highline2[shift] = H2;
      lowline2[shift] = L2;
    }

    //for (shift = limit; shift >= 0; shift--) {
 //     if (shift < CountBars-SmoothingLength-1) {
 //        smoothed[shift] = iMAOnArray(centerline,0,SmoothingLength,ma_shift,MODE_SMA,shift);
//         smoothedhigh[shift] = smoothed[shift] + range/2*WidthPCT/100;
//         smoothedlow[shift] = smoothed[shift]- range/2*WidthPCT/100;
//
//      } else
//         smoothed[shift] = 0.0;
//
//   }
   return(0);
}
//+------------------------------------------------------------------+
Comments