StepMA_Stoch_v1_sound
Download script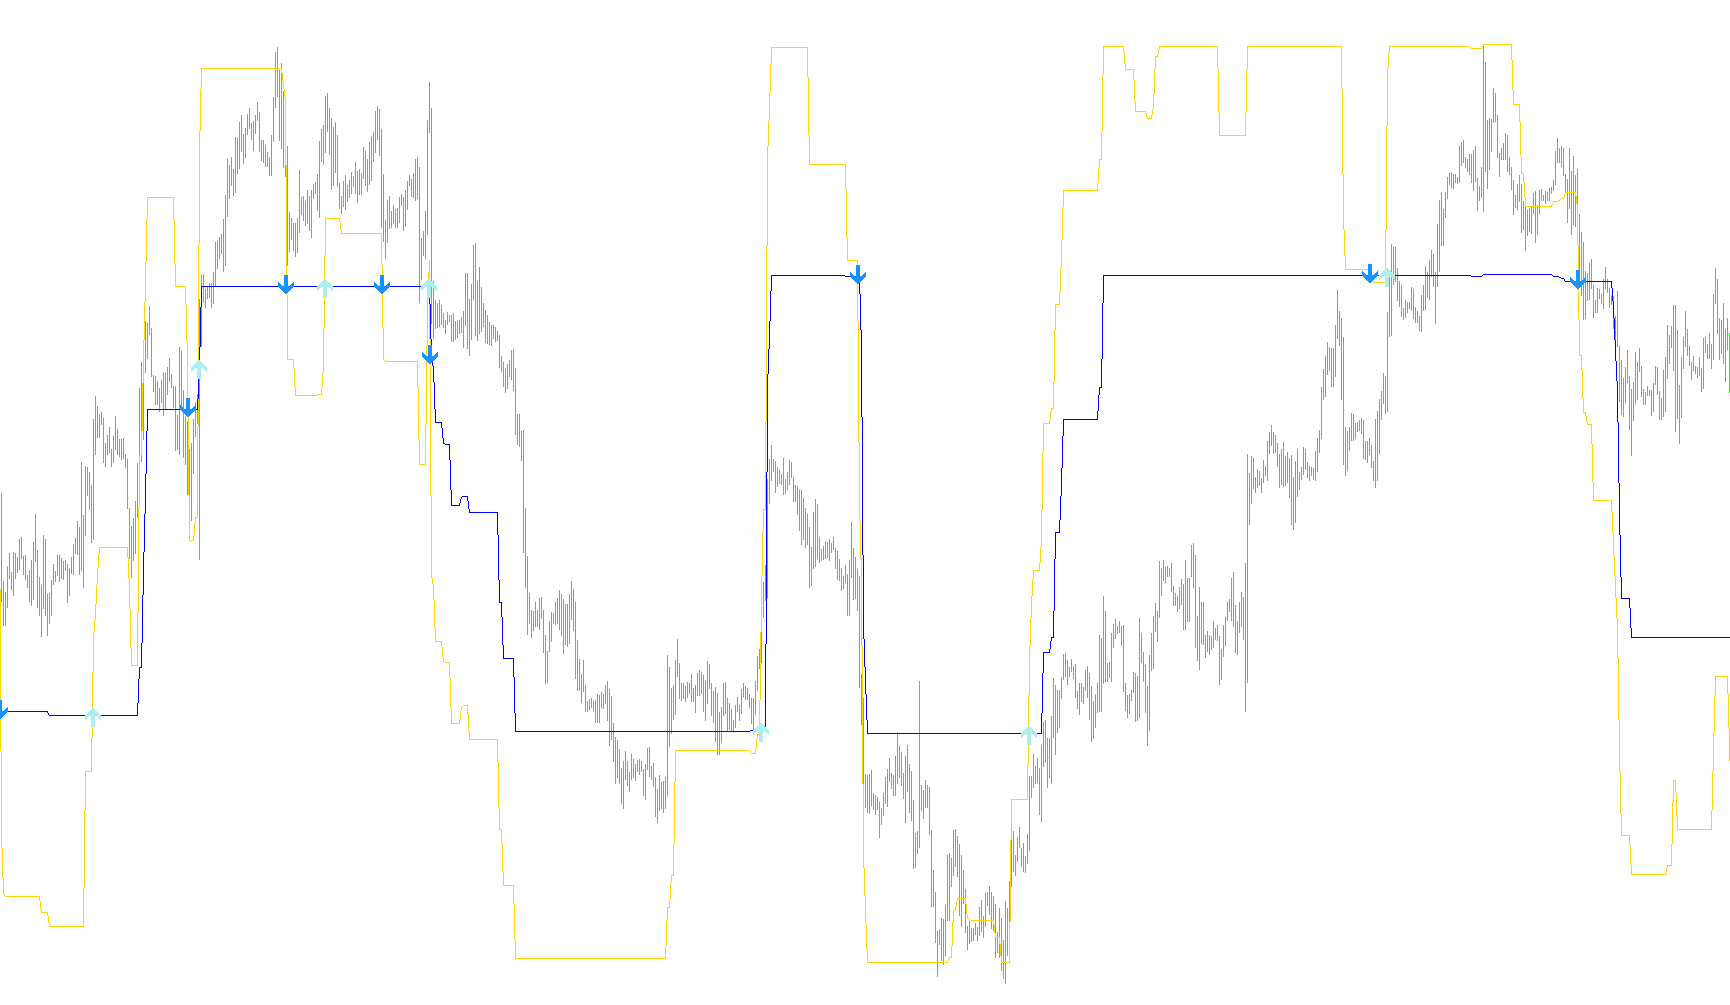
This technical indicator is designed to help traders visualize market trends and identify potential entry or exit points by analyzing price volatility and momentum. Rather than following a standard moving average, it uses a "stepping" logic to create more stable trend boundaries.
Core Logic Overview
The script operates by calculating the historical range of price movements (the difference between highs and lows) over a specific timeframe. It then takes these values and transforms them into three distinct "trend bands": Minimum, Maximum, and Middle.
By using these bands, the indicator attempts to filter out minor market noise, focusing instead on the broader structure of the price movement. Because it is a "Step" type logic, the trend lines do not move fluidly with every tiny price tick; instead, they maintain their position until a significant enough price change occurs to "step" them to a new level.
Key Functionalities
- Dynamic Volatility Tracking: The script constantly monitors the recent range of the market. It uses a weighting system where more recent price actions have a slightly higher influence on the current calculation than older data.
- Trend Identification: Based on the relationship between the current closing price and these "step" boundaries, the indicator determines the prevailing trend direction (Up, Down, or Neutral).
- Dual Momentum Lines: The tool produces two primary visual lines on your chart:
- A Minimum Line: Represents the lower bound of the current trend intensity.
- A Middle Line: Represents the central equilibrium of the price movement.
- Signal Generation (Arrows): The indicator is designed to identify "crosses." When the Minimum line crosses over the Middle line, it signifies a shift in momentum that may indicate a buying opportunity. Conversely, when it crosses below, it may signal a selling opportunity. These signals are marked on the chart with arrows for easy identification.
User Alerts
The script includes a built-in notification system. When the two primary trend lines cross each other—confirming a significant shift in momentum—the indicator can trigger an audible alert to notify the trader immediately, ensuring they don't have to watch the screen constantly to catch a trend reversal.
Summary for the Trader
In simple terms, this tool helps you see where the "floor" and "ceiling" of the current market movement are located. By watching how the primary lines interact with each other, you can identify when a trend is gaining strength or beginning to weaken, allowing for more disciplined decision-making based on momentum shifts rather than emotional reactions to price volatility.
//+------------------------------------------------------------------+
//|                                                Nina_StepMA_1.mq4 |
//+------------------------------------------------------------------+
#property indicator_separate_window

#property indicator_buffers 4
#property indicator_color1 Magenta
#property indicator_color2 Aqua
#property indicator_color3 Yellow
#property indicator_color4 Orange
#property indicator_width3 2
#property indicator_width4 2

#property indicator_minimum 0
#property indicator_maximum 1

//----input parameters
extern int PeriodWATR=15;// was 7
extern double Kwatr= 1.5;//was .7
extern int HighLow=0;
extern int CalculatedBars = 2000;//was 500
extern bool alert_ON=true; // ON=true, OFF=false

//---- indicator buffers
double LineMinBuffer[];
double LineMidBuffer[];
double LineBuyBuffer[];
double LineSellBuffer[];
double alertBar;

//+------------------------------------------------------------------+
//| Custom indicator initialization function                         |
//+------------------------------------------------------------------+
int init()
  {
  string short_name;
  IndicatorBuffers(4);
//---- indicator line
   SetIndexStyle(0,DRAW_LINE,STYLE_SOLID,1);
   SetIndexStyle(1,DRAW_LINE,STYLE_SOLID,1);
   SetIndexStyle(2,DRAW_ARROW,STYLE_SOLID,2);
   SetIndexStyle(3,DRAW_ARROW,STYLE_SOLID,2);

   SetIndexEmptyValue(2,0);
   SetIndexArrow(2,233);
   SetIndexEmptyValue(3,0);
   SetIndexArrow(3,234);

   SetIndexBuffer(0,LineMinBuffer);
   SetIndexBuffer(1,LineMidBuffer);
   SetIndexBuffer(2,LineBuyBuffer);
   SetIndexBuffer(3,LineSellBuffer);

   IndicatorDigits(MarketInfo(Symbol(),MODE_DIGITS));
//---- name for DataWindow and indicator subwindow label
   short_name="StepMA_Stoch("+PeriodWATR+","+Kwatr+","+HighLow+")";
   IndicatorShortName(short_name);
//----
   SetIndexDrawBegin(0,PeriodWATR);
   SetIndexDrawBegin(1,PeriodWATR);
//----
   return(0);
  }
//+------------------------------------------------------------------+
//| Custom indicator deinitialization function                       |
//+------------------------------------------------------------------+
int deinit()
  {
//----

//----
   return(0);
  }
//+------------------------------------------------------------------+
//| Custom indicator iteration function                              |
//+------------------------------------------------------------------+
int start()
  {
   int      i,shift,TrendMin,TrendMax,TrendMid;
   double   SminMin0,SmaxMin0,SminMin1,SmaxMin1,SumRange,dK,WATR0,WATRmax,WATRmin,WATRmid;
   double   SminMax0,SmaxMax0,SminMax1,SmaxMax1,SminMid0,SmaxMid0,SminMid1,SmaxMid1;
   double   linemin,linemax,linemid,Stoch1,Stoch2,bsmin,bsmax;
   static bool turn_alarm = true;

   int StepSizeMin,StepSizeMax,StepSizeMid;
   double min,max,mid,h,l,c;
   int position_ind0=0, position_ind1=0;
   // position_ind0 = -1, below
   //               =  1, up

   ArrayInitialize(LineBuyBuffer,0);
   ArrayInitialize(LineSellBuffer,0);

   if(CalculatedBars>Bars || CalculatedBars == 0 ) CalculatedBars = Bars;

   for(shift=CalculatedBars-1;shift>=0;shift--){
	  SumRange=0;
	  for (i=PeriodWATR-1;i>=0;i--){
         dK = 1+1.0*(PeriodWATR-i)/PeriodWATR;
         SumRange+= dK*MathAbs(High[i+shift]-Low[i+shift]);
         }
	  WATR0 = SumRange/PeriodWATR;

	  WATRmax=MathMax(WATR0,WATRmax);
	  if (shift==CalculatedBars-1-PeriodWATR) WATRmin=WATR0;
	  WATRmin=MathMin(WATR0,WATRmin);

	  StepSizeMin=MathRound(Kwatr*WATRmin/Point);
	  StepSizeMax=MathRound(Kwatr*WATRmax/Point);
	  StepSizeMid=MathRound(Kwatr*0.5*(WATRmax+WATRmin)/Point);

     min = Kwatr*WATRmin;
     max = Kwatr*WATRmax;
     mid = Kwatr*0.5*(WATRmax+WATRmin);

	  //b = iBarShift(Symbol(),tPeriod,Time[shift]);
	  c = Close[shift];//iClose(Symbol(),tPeriod,b);
	  h = High[shift];//iHigh(Symbol(),tPeriod,b)
	  l = Low[shift];//iLow(Symbol(),tPeriod,b)

	  if (HighLow>0){
	    SmaxMin0=l+2*min;
	    SminMin0=h-2*min;

	    SmaxMax0=l+2*max;
	    SminMax0=h-2*max;

	    SmaxMid0=l+2*mid;
	    SminMid0=h-2*mid;

	    if(c>SmaxMin1) TrendMin=1;
	    if(c<SminMin1) TrendMin=-1;

	    if(c>SmaxMax1) TrendMax=1;
	    if(c<SminMax1) TrendMax=-1;

	    if(c>SmaxMid1) TrendMid=1;
	    if(c<SminMid1) TrendMid=-1;
	    }

	  if (HighLow == 0){
	    SmaxMin0=c+2*min;
	    SminMin0=c-2*min;

	    SmaxMax0=c+2*max;
	    SminMax0=c-2*max;

	    SmaxMid0=c+2*mid;
	    SminMid0=c-2*mid;

	    if(c>SmaxMin1) TrendMin=1;
	    if(c<SminMin1) TrendMin=-1;

	    if(c>SmaxMax1) TrendMax=1;
	    if(c<SminMax1) TrendMax=-1;

	    if(c>SmaxMid1) TrendMid=1;
	    if(c<SminMid1) TrendMid=-1;
	    }

	  if(TrendMin>0 && SminMin0<SminMin1) SminMin0=SminMin1;
	  if(TrendMin<0 && SmaxMin0>SmaxMin1) SmaxMin0=SmaxMin1;

	  if(TrendMax>0 && SminMax0<SminMax1) SminMax0=SminMax1;
	  if(TrendMax<0 && SmaxMax0>SmaxMax1) SmaxMax0=SmaxMax1;

	  if(TrendMid>0 && SminMid0<SminMid1) SminMid0=SminMid1;
	  if(TrendMid<0 && SmaxMid0>SmaxMid1) SmaxMid0=SmaxMid1;


	  if (TrendMin>0) linemin=SminMin0+min;
	  if (TrendMin<0) linemin=SmaxMin0-min;

	  if (TrendMax>0) linemax=SminMax0+max;
	  if (TrendMax<0) linemax=SmaxMax0-max;

	  if (TrendMid>0) linemid=SminMid0+mid;
	  if (TrendMid<0) linemid=SmaxMid0-mid;

	  bsmin=linemax-max;
	  bsmax=linemax+max;
	  Stoch1=(linemin-bsmin)/(bsmax-bsmin);
	  Stoch2=(linemid-bsmin)/(bsmax-bsmin);

	  LineMinBuffer[shift]=Stoch1;
	  LineMidBuffer[shift]=Stoch2;


	  SminMin1=SminMin0;
	  SmaxMin1=SmaxMin0;

	  SminMax1=SminMax0;
	  SmaxMax1=SmaxMax0;

	  SminMid1=SminMid0;
	  SmaxMid1=SmaxMid0;

	  // don't do anything for current bar since it is keeping changing.
	  if(shift != 0) {
   	  position_ind0 = position_ind1;
   	  if(LineMinBuffer[shift]>LineMidBuffer[shift]){
   	     position_ind1=1;
   	  }
   	  else {
   	     position_ind1=-1;
   	  }
	  // current bar is keeping on changing
	  // so don't put arrow on it
	  // that means we only set on signal for confirmed bar
	     if((position_ind0==-1) && (position_ind1==1)) {
	     // cross up
	        LineBuyBuffer[shift] = LineMidBuffer[shift];
	     }
	     if((position_ind0==1) && (position_ind1==-1)) {
	     // cross down
	        LineSellBuffer[shift] = LineMidBuffer[shift];
	     }
	   }
   }

	if(Volume[0]>1) return(0);

	if(alert_ON) {
      if(position_ind0*position_ind1<0) {  // time for alarm
         Alert ("StepStoch crossed on ",Symbol(),"-",Period());
         turn_alarm=false;
      }
   }

	return(0);
 }
//+------------------------------------------------------------------+
Comments