SilverTrend_Signal1
Download script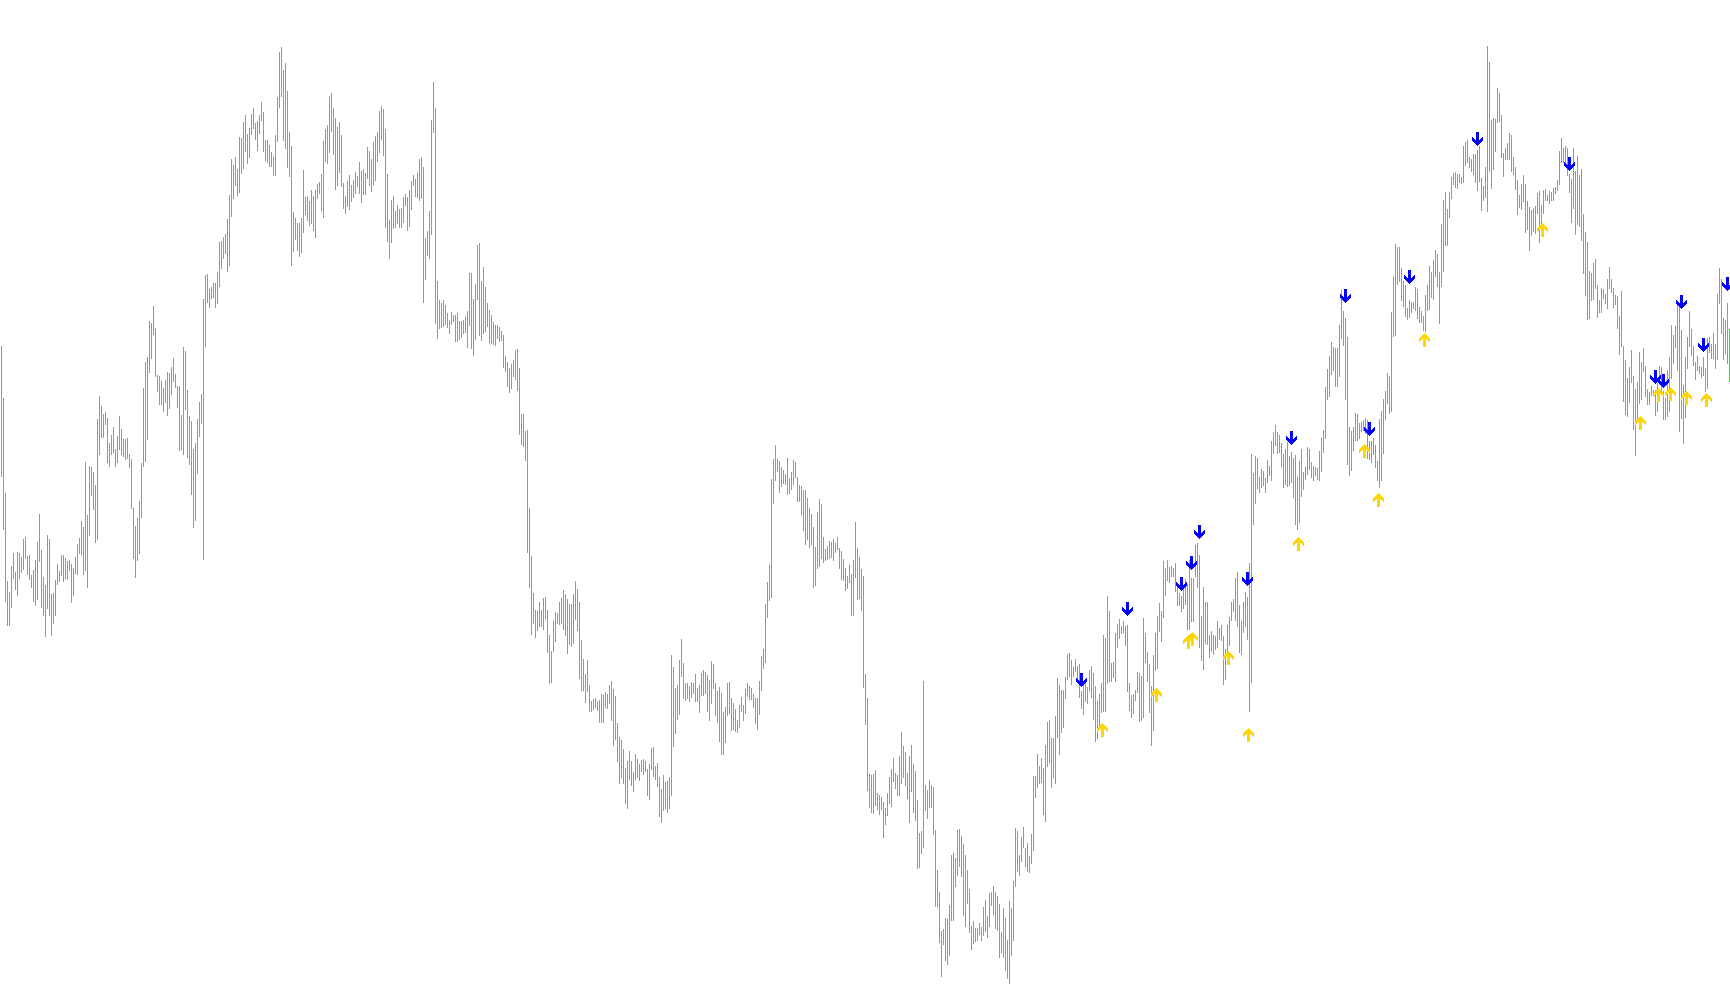
The SilverTrend_Signal tool is designed to help traders identify clear shifts in market momentum by detecting when a price trend changes direction. Instead of cluttering your screen with constant lines, this script focuses on identifying specific "turning points" and displaying them as visual signals on your chart.
How the Logic Works
The script analyzes historical price data over a specific window of time to determine the prevailing trend. Here is the step-by-step breakdown of its internal logic:
1. Range and Volatility Assessment Before making any decisions, the tool looks at a set number of recent candles to calculate the "Average Range." It measures how much the price typically moves between its highest and lowest points in a given period. This helps the script understand the current volatility of the market—knowing whether the price is moving calmly or swinging wildly.
2. Dynamic Boundary Calculation The tool identifies the highest high and the lowest low within its active look-back window. Based on these extremes, it creates two invisible "boundary levels":
- A Lower Bound: Calculated by projecting a percentage inward from the bottom of the recent price range.
- An Upper Bound: Calculated by projecting a percentage inward from the top of the recent price range.
The "Risk" setting allows you to adjust how deep into these boundaries the calculation goes, effectively making the signal more or less sensitive to minor price fluctuations.
3. Trend Detection The script monitors the closing price of each candle against these two boundaries:
- If the price closes above the Upper Bound, the logic recognizes a potential upward trend.
- If the price closes below the Lower Bound, the logic recognizes a potential downward trend.
4. Signal Generation (The "Flip") The most important feature of this script is its ability to detect a "Trend Flip." The tool only places a visual marker on your chart at the exact moment the trend changes from up to down, or vice versa.
- Bullish Signal: When the price moves from being below the boundaries to breaking above the upper boundary, it marks the start of an uptrend.
- Bearish Signal: When the price moves from being above the boundaries to breaking below the lower boundary, it marks the start of a downtrend.
Summary for the Trader
This tool filters out "market noise" by ignoring small price wiggles. It only triggers a signal when the price makes a significant enough move to break out of its recent historical range. By using the average range to position these markers, it ensures that the signals appear at a consistent distance from the candles, providing a clean and professional visual cue for trend reversals.
//+------------------------------------------------------------------+
//| SilverTrend_Signal.mq4
//| Ramdass - Conversion only
//+------------------------------------------------------------------+
#property copyright "SilverTrend  rewritten by CrazyChart"
#property link      "http://viac.ru/"

#property indicator_chart_window
#property indicator_buffers 2
#property indicator_color1 Aqua
#property indicator_color2 Violet

//---- input parameters
extern int RISK=3;
extern int CountBars=350;
int SSP=9;

//---- buffers
double val1[];
double val2[];

//+------------------------------------------------------------------+
//| Custom indicator initialization function                         |
//+------------------------------------------------------------------+
int init()
  {
   string short_name;
//---- indicator line
   IndicatorBuffers(2);
   SetIndexStyle(0,DRAW_ARROW);
   SetIndexArrow(0,233);
   SetIndexStyle(1,DRAW_ARROW);
   SetIndexArrow(1,234);
   SetIndexBuffer(0,val1);
   SetIndexBuffer(1,val2);
//----
   return(0);
  }
//+------------------------------------------------------------------+
//| SilverTrend_Signal                                               |
//+------------------------------------------------------------------+
int start()
  {
   if (CountBars>=Bars) CountBars=Bars;
   SetIndexDrawBegin(0,Bars-CountBars+SSP);
   SetIndexDrawBegin(1,Bars-CountBars+SSP);
   int i,shift,counted_bars=IndicatorCounted();
   int i1,i2,K;
   double Range,AvgRange,smin,smax,SsMax,SsMin,price;
   bool uptrend,old;
//----

   if(Bars<=SSP+1) return(0);
//---- initial zero
   if(counted_bars<SSP+1)
   {
      for(i=1;i<=SSP;i++) val1[CountBars-i]=0.0;
      for(i=1;i<=SSP;i++) val2[CountBars-i]=0.0;
   }
//----

K=33-RISK;
for (shift = CountBars-SSP; shift>=0; shift--)
{

	Range=0;
	AvgRange=0;
	for (i1=shift; i1<=shift+SSP; i1++)
		{AvgRange=AvgRange+MathAbs(High[i1]-Low[i1]);
		}
	Range=AvgRange/(SSP+1);

SsMax=High[shift]; SsMin=Low[shift];
   for (i2=shift;i2<=shift+SSP-1;i2++)
        {
         price=High[i2];
         if(SsMax<price) SsMax=price;
         price=Low[i2];
         if(SsMin>=price)  SsMin=price;
        }

smin = SsMin+(SsMax-SsMin)*K/100;
smax = SsMax-(SsMax-SsMin)*K/100;
	val1[shift]=0;
	val2[shift]=0;
	if (Close[shift]<smin)
		{
		uptrend = false;
		}
	if (Close[shift]>smax)
		{
		uptrend = true;
		}
   if (uptrend!=old && uptrend==true) {val1[shift]=Low[shift]-Range*0.5;}
   if (uptrend!=old && uptrend==false) {val2[shift]=High[shift]+Range*0.5;}

// Comment(shift);
   old=uptrend;

}
   return(uptrend);
  }
//+------------------------------------------------------------------+
Comments