JMA RSX_v2
Download script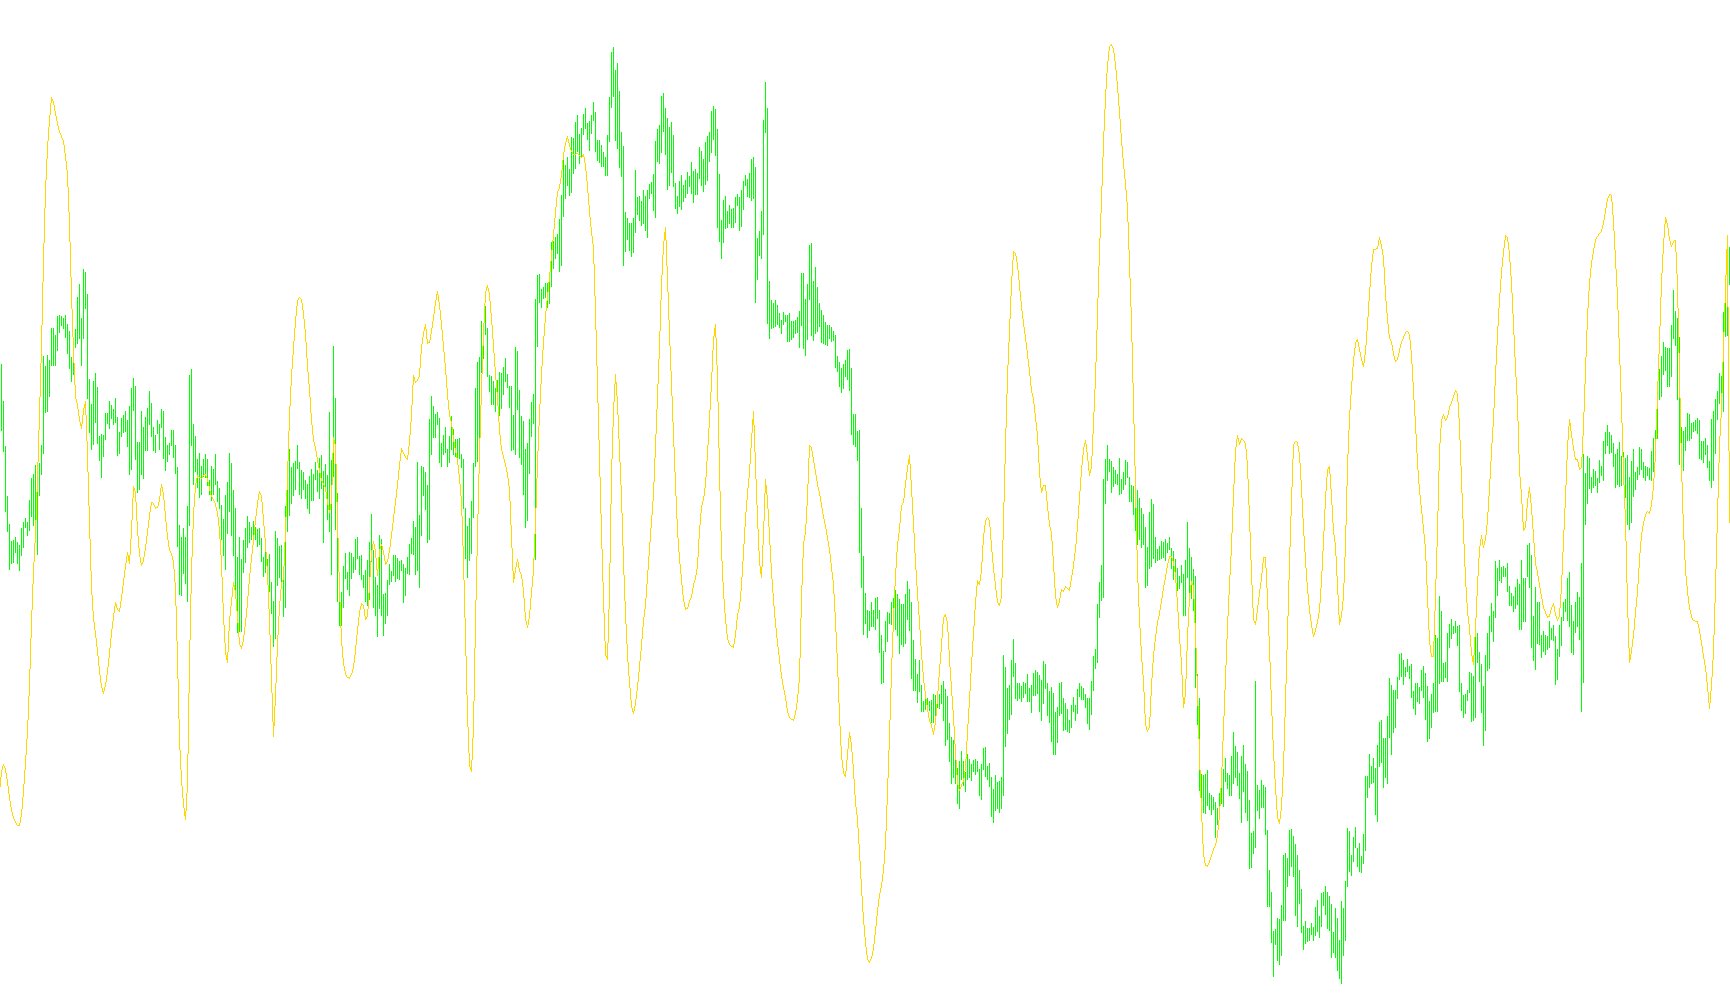
This technical indicator is designed to analyze price movements and provide a visual representation of market momentum and trend strength. It operates in a separate window on your trading platform, creating a numerical scale from 0 to 100 that helps traders gauge the intensity of current price fluctuations.
How the Logic Works
Data Processing and Smoothing The script begins by taking the closing prices of the assets over a specific period (defined by the user). Rather than looking at raw, jagged price movements, it applies a series of mathematical "smoothing" filters. It calculates the difference between current and previous prices and runs them through multiple layers of weighted averages. This process removes "noise" from the market, allowing the indicator to identify the underlying direction of the trend more clearly.
Momentum Calculation The core of the logic involves tracking how quickly price changes are accelerating or decelerating. By layering these smoothed calculations (specifically using coefficients that weight recent data more heavily), the script generates a momentum value. It effectively measures whether the current move is gaining strength, losing steam, or remaining neutral.
Normalization to a 0-100 Scale To make the data easy for a human to interpret, the script converts these complex momentum calculations into a standardized scale:
- The Neutral Point: The indicator defaults to a value of 50, representing a state where there is no significant upward or downward bias detected.
- Dynamic Scaling: When the price begins to move decisively, the logic calculates a percentage based on the relative strength of the trend compared to its recent history.
- Boundary Limits: The script ensures that these results never exceed the 0 to 100 range. If the momentum is exceptionally high or low, it will "cap" at the maximum or minimum limits of the scale.
Visual Interpretation
The resulting line on your chart provides a real-time look at market sentiment:
- Movements toward 100: Suggest a strong bullish trend or upward momentum.
- Movements toward 0: Suggest a strong bearish trend or downward momentum.
- Hovering near 50: Indicates a sideways market, consolidation, or an equilibrium where neither buyers nor sellers have established clear dominance.
//+------------------------------------------------------------------+
//|                                                                  |
//|                 Copyright © 2000-2007, MetaQuotes Software Corp. |
//|                                         http://www.metaquotes.ru |
//+------------------------------------------------------------------+
#property copyright "strategybuilderfx.com"
#property link "finger"
//----
#property indicator_separate_window
#property indicator_buffers 1
#property indicator_color1 Magenta
#property indicator_level1 70
#property indicator_level2 30
#property indicator_level3 50
#property indicator_maximum 100
#property indicator_minimum 0
//---- input parameters
extern int Len=14; //---- buffers
double rsx[];
double f88, f90;
double f0, v4, v8, vC, v10, v14, v18, v20;
double f8, f10, f18, f20, f28, f30, f38, f48, v1C;
double f50, f58, f60, f68, f70, f78, f80, f40;
//+------------------------------------------------------------------+
//|                                                                  |
//+------------------------------------------------------------------+
  int init()
  {
   SetIndexStyle(0,DRAW_LINE);
   SetIndexBuffer(0,rsx);
   IndicatorShortName("rsxc("+Len+")");
   return(0);
  }
//+------------------------------------------------------------------+
//|                                                                  |
//+------------------------------------------------------------------+
int deinit()
  {
   return(0);
  }
//+------------------------------------------------------------------+
//|                                                                  |
//+------------------------------------------------------------------+
int start()
  {
   int counted_bars=IndicatorCounted(),limit,shift;
//----
   if (counted_bars<0) return(-1);
   if (counted_bars>0) counted_bars--;
   limit=Bars-Len-1;
   if(counted_bars>Len) limit=Bars-counted_bars-1;
//----
     for(shift=limit;shift>=0;shift--)
     {
        if (f90==0.0)
        {
         f90=1.0;
         f0=0.0;
         if (Len-1>=5) f88=Len-1.0; else f88=5.0;
         f8=100.0*(Close[shift]);
         f18=3.0/(Len + 2.0);
         f20=1.0 - f18;
         }
          else
         {
         if (f88<=f90) f90=f88 + 1;
         else
            f90=f90 + 1;
         f10=f8;
         f8=100*Close[shift];
         v8=f8 - f10;
         f28=f20 * f28 + f18 * v8;
         f30=f18 * f28 + f20 * f30;
         vC=f28 * 1.5 - f30 * 0.5;
         f38=f20 * f38 + f18 * vC;
         f40=f18 * f38 + f20 * f40;
         v10=f38 * 1.5 - f40 * 0.5;
         f48=f20 * f48 + f18 * v10;
         f50=f18 * f48 + f20 * f50;
         v14=f48 * 1.5 - f50 * 0.5;
         f58=f20 * f58 + f18 * MathAbs(v8);
         f60=f18 * f58 + f20 * f60;
         v18=f58 * 1.5 - f60 * 0.5;
         f68=f20 * f68 + f18 * v18;
         //
         f70=f18 * f68 + f20 * f70;
         v1C=f68 * 1.5 - f70 * 0.5;
         f78=f20 * f78 + f18 * v1C;
         f80=f18 * f78 + f20 * f80;
         v20=f78 * 1.5 - f80 * 0.5;
         //
         if ((f88>=f90) && (f8!=f10)) f0=1.0;
         if ((f88==f90) && (f0==0.0)) f90=0.0;
        }
        if ((f88 < f90) && (v20 > 0.0000000001))
        {
         v4=(v14/v20 + 1.0) * 50.0;
         if (v4 > 100.0) v4=100.0;
         if (v4 < 0.0) v4=0.0;
         }
          else
         {
         v4=50.0;
        }
      rsx[shift]=v4;
     }
   return(0);
  }
//+------------------------------------------------------------------+
Comments