Heiken_Ashi_Ma
Download script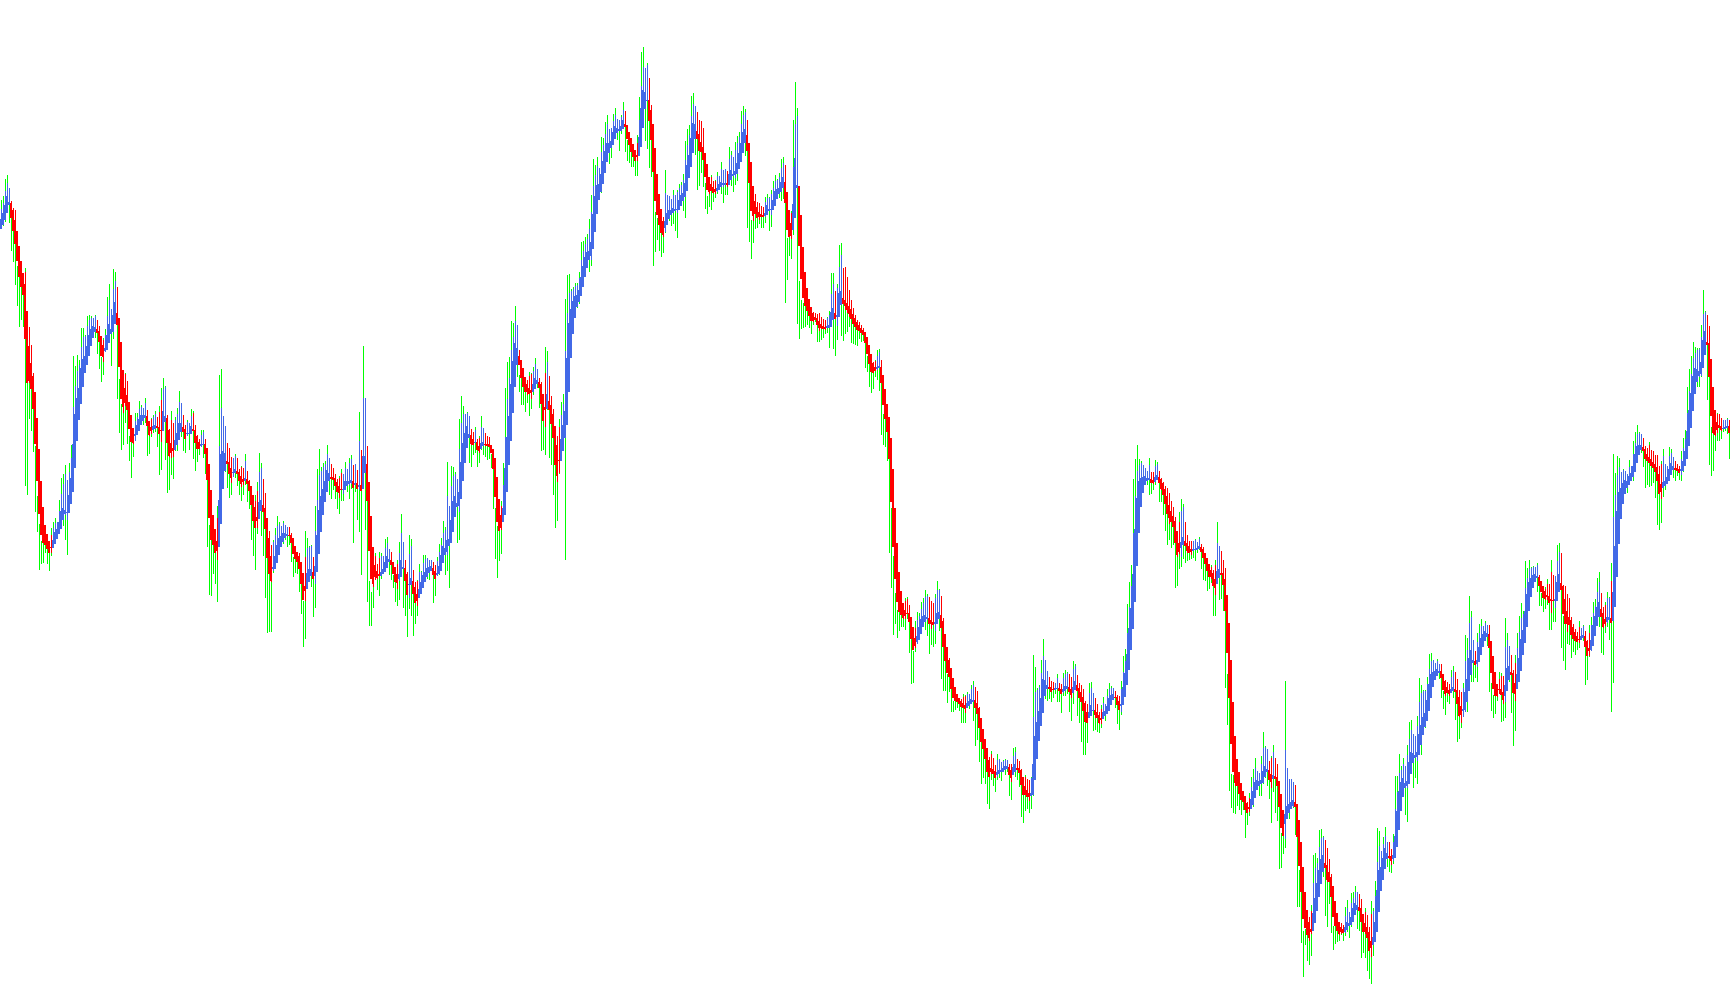
This tool is designed to provide a smoothed, visual representation of price action by combining two distinct types of technical analysis: Moving Averages and Heikin Ashi logic. Instead of looking at raw, jagged price movements, this script processes the data to create a cleaner "histogram" style display that helps traders identify trends more clearly.
How the Logic Works
The core functionality of this script relies on a multi-step mathematical transformation of your chart's data:
1. Data Smoothing (Moving Averages) The script begins by looking at specific price points—the High, Low, Open, and Close prices—over a user-defined period. Rather than taking these prices as they are, it applies a "Moving Average" calculation to them. This removes "market noise" and helps establish a more stable baseline for the price action.
2. Heikin Ashi Conversion Once the smoothed data is gathered, the script applies Heikin Ashi logic. In traditional charts, candles represent raw price; in Heikin Ashi, candles represent an average of price movement.
- Opening Prices: The script calculates a new "opening" price by averaging the previous period's values.
- Closing Prices: It calculates a new "closing" price by taking the average of the High, Low, Open, and Close of the current smoothed data.
3. Dynamic Range Calculation To determine the visual "length" of the bars on your chart (the highs and lows), the script compares the newly calculated opening and closing values:
- It identifies the highest point between the high, open, and close to set the top of the bar.
- It identifies the lowest point between the low, open, and close to set the bottom of the bar.
4. Visual Output Finally, the script organizes these calculations into a multi-colored histogram. Because it uses these averages to define the bars, the resulting visual is much smoother than a standard candlestick chart. It is designed to highlight the momentum of the market—showing you clearly whether the trend is currently leaning upward or downward by filtering out minor, insignificant price fluctuations.
//+------------------------------------------------------------------+
//|                                               Heiken Ashi Ma.mq4 |
//+------------------------------------------------------------------+
//|                                                      mod by Raff |
//+------------------------------------------------------------------+
#property copyright "Copyright © 2006, Forex-TSD.com "
#property link      "http://www.forex-tsd.com/"

#property indicator_chart_window
#property indicator_buffers 4
#property indicator_color1 DarkOrange
#property indicator_color2 Turquoise
#property indicator_color3 Red
#property indicator_color4 RoyalBlue
//---- parameters
extern int MaMetod  = 1;
extern int MaPeriod = 3;
//---- buffers
double ExtMapBuffer1[];
double ExtMapBuffer2[];
double ExtMapBuffer3[];
double ExtMapBuffer4[];
//----
int ExtCountedBars=0;
//+------------------------------------------------------------------+
//| Custom indicator initialization function                         |
//|------------------------------------------------------------------|
int init()
  {
//---- indicators
   SetIndexStyle(0,DRAW_HISTOGRAM, 0, 1, Red);
   SetIndexBuffer(0, ExtMapBuffer1);
   SetIndexStyle(1,DRAW_HISTOGRAM, 0, 1, RoyalBlue);
   SetIndexBuffer(1, ExtMapBuffer2);
   SetIndexStyle(2,DRAW_HISTOGRAM, 0, 3, Red);
   SetIndexBuffer(2, ExtMapBuffer3);
   SetIndexStyle(3,DRAW_HISTOGRAM, 0, 3, RoyalBlue);
   SetIndexBuffer(3, ExtMapBuffer4);
//----
   SetIndexDrawBegin(0,5);
//---- indicator buffers mapping
   SetIndexBuffer(0,ExtMapBuffer1);
   SetIndexBuffer(1,ExtMapBuffer2);
   SetIndexBuffer(2,ExtMapBuffer3);
   SetIndexBuffer(3,ExtMapBuffer4);
//---- initialization done
   return(0);
  }
//+------------------------------------------------------------------+
//| Custor indicator deinitialization function                       |
//+------------------------------------------------------------------+
int deinit()
  {
//---- TODO: add your code here

//----
   return(0);
  }
//+------------------------------------------------------------------+
//| Custom indicator iteration function                              |
//+------------------------------------------------------------------+
int start()
  {
   double maOpen, maClose, maLow, maHigh;
   double haOpen, haHigh, haLow, haClose;
   if(Bars<=10) return(0);
   ExtCountedBars=IndicatorCounted();
//---- check for possible errors
   if (ExtCountedBars<0) return(-1);
//---- last counted bar will be recounted
   if (ExtCountedBars>0) ExtCountedBars--;
   int pos=Bars-ExtCountedBars-1;
   while(pos>=0)
     {
      maOpen=iMA(NULL,0,MaPeriod,0,MaMetod,MODE_OPEN,pos);
      maClose=iMA(NULL,0,MaPeriod,0,MaMetod,MODE_CLOSE,pos);
      maLow=iMA(NULL,0,MaPeriod,0,MaMetod,MODE_LOW,pos);
      maHigh=iMA(NULL,0,MaPeriod,0,MaMetod,MODE_HIGH,pos);

      haOpen=(ExtMapBuffer3[pos+1]+ExtMapBuffer4[pos+1])/2;
      haClose=(maOpen+maHigh+maLow+maClose)/4;
      haHigh=MathMax(maHigh, MathMax(haOpen, haClose));
      haLow=MathMin(maLow, MathMin(haOpen, haClose));
      if (haOpen<haClose)
        {
         ExtMapBuffer1[pos]=haLow;
         ExtMapBuffer2[pos]=haHigh;
        }
      else
        {
         ExtMapBuffer1[pos]=haHigh;
         ExtMapBuffer2[pos]=haLow;
        }
      ExtMapBuffer3[pos]=haOpen;
      ExtMapBuffer4[pos]=haClose;
 	   pos--;
     }
//----
   return(0);
  }
//+------------------------------------------------------------------+
Comments