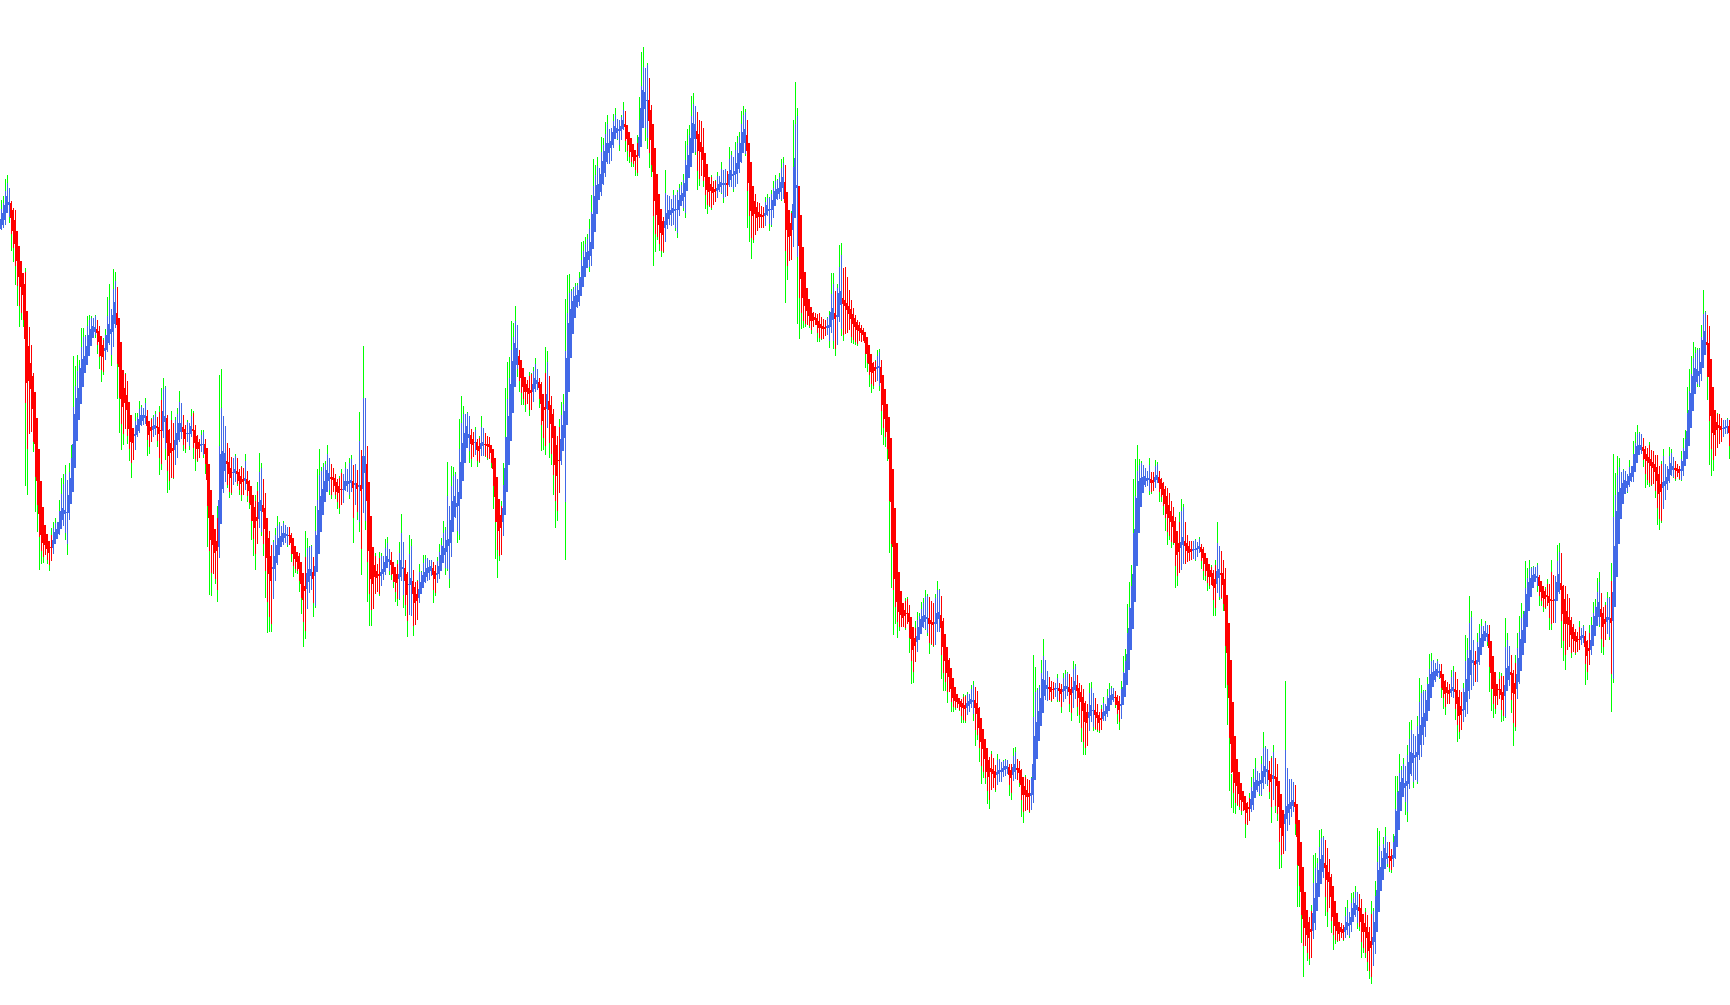
This tool is designed to provide traders with a smoothed, visual representation of price action by combining two distinct types of technical analysis: Moving Averages and Heiken Ashi calculations. Instead of showing raw, volatile price movements, it filters the market data to highlight underlying trends more clearly.
Core Logic Overview
The script functions by transforming standard price data into a modified "Heiken Ashi" format. While standard candles can be noisy due to sudden spikes, this indicator uses a Moving Average (MA) as its primary foundation. By calculating the average of several previous price points based on user-defined periods and methods, it creates a "smoothed" baseline for the market's movement.
How the Data is Processed
The logic follows a specific sequence to generate the visual output:
- Smoothing Inputs: The script retrieves four key pieces of data from the current market—Open, High, Low, and Close prices—but it does not use them in their raw form. Instead, it calculates the Moving Average for each of these four components.
- Hybrid Calculation: It then takes those smoothed averages and plugs them into a Heiken Ashi formula. Specifically, it determines a new "Average Open" by looking at the previous values and a new "Average Close" by averaging the current smoothed highs, lows, opens, and closes.
- Dynamic Range Detection: The script identifies the highest and lowest points of the current price action (the "wicks"). It compares these against the calculated open and close prices to ensure that the visual representation accurately reflects the boundaries of the market's movement.
Visual Interpretation
The final result is plotted on your chart as a series of histograms. The logic distinguishes between bullish and bearish movements automatically:
- Trend Identification: By comparing the calculated "Average Open" against the "Average Close," the script determines the direction of the trend.
- Color and Positioning: Depending on whether the market is moving upward or downward, the script assigns specific coordinates for the high and low points. This allows traders to see a more continuous flow of momentum, making it easier to identify whether the current price action is sustained or undergoing a reversal.
By using this logic, the tool seeks to strip away the " बाजार" (market) noise, providing a cleaner look at the prevailing trend by blending mathematical averaging with smoothed candle geometry.
//+------------------------------------------------------------------+
//|                                               Heiken Ashi Ma.mq4 |
//+------------------------------------------------------------------+
//|                                                      mod by Raff |
//+------------------------------------------------------------------+
#property copyright "Copyright © 2006, Forex-TSD.com "
#property link      "http://www.forex-tsd.com/"

#property indicator_chart_window
#property indicator_buffers 4
#property indicator_color1 DarkOrange
#property indicator_color2 Turquoise
#property indicator_color3 Red
#property indicator_color4 RoyalBlue
//---- parameters
extern int MaMetod  = 1;
extern int MaPeriod = 3;
//---- buffers
double ExtMapBuffer1[];
double ExtMapBuffer2[];
double ExtMapBuffer3[];
double ExtMapBuffer4[];
//----
int ExtCountedBars=0;
//+------------------------------------------------------------------+
//| Custom indicator initialization function                         |
//|------------------------------------------------------------------|
int init()
  {
//---- indicators
   SetIndexStyle(0,DRAW_HISTOGRAM, 0, 1, Red);
   SetIndexBuffer(0, ExtMapBuffer1);
   SetIndexStyle(1,DRAW_HISTOGRAM, 0, 1, RoyalBlue);
   SetIndexBuffer(1, ExtMapBuffer2);
   SetIndexStyle(2,DRAW_HISTOGRAM, 0, 3, Red);
   SetIndexBuffer(2, ExtMapBuffer3);
   SetIndexStyle(3,DRAW_HISTOGRAM, 0, 3, RoyalBlue);
   SetIndexBuffer(3, ExtMapBuffer4);
//----
   SetIndexDrawBegin(0,5);
//---- indicator buffers mapping
   SetIndexBuffer(0,ExtMapBuffer1);
   SetIndexBuffer(1,ExtMapBuffer2);
   SetIndexBuffer(2,ExtMapBuffer3);
   SetIndexBuffer(3,ExtMapBuffer4);
//---- initialization done
   return(0);
  }
//+------------------------------------------------------------------+
//| Custor indicator deinitialization function                       |
//+------------------------------------------------------------------+
int deinit()
  {
//---- TODO: add your code here

//----
   return(0);
  }
//+------------------------------------------------------------------+
//| Custom indicator iteration function                              |
//+------------------------------------------------------------------+
int start()
  {
   double maOpen, maClose, maLow, maHigh;
   double haOpen, haHigh, haLow, haClose;
   if(Bars<=10) return(0);
   ExtCountedBars=IndicatorCounted();
//---- check for possible errors
   if (ExtCountedBars<0) return(-1);
//---- last counted bar will be recounted
   if (ExtCountedBars>0) ExtCountedBars--;
   int pos=Bars-ExtCountedBars-1;
   while(pos>=0)
     {
      maOpen=iMA(NULL,0,MaPeriod,0,MaMetod,PRICE_OPEN,pos);
      maClose=iMA(NULL,0,MaPeriod,0,MaMetod,PRICE_CLOSE,pos);
      maLow=iMA(NULL,0,MaPeriod,0,MaMetod,PRICE_LOW,pos);
      maHigh=iMA(NULL,0,MaPeriod,0,MaMetod,PRICE_HIGH,pos);

      haOpen=(ExtMapBuffer3[pos+1]+ExtMapBuffer4[pos+1])/2;
      haClose=(maOpen+maHigh+maLow+maClose)/4;
      haHigh=MathMax(maHigh, MathMax(haOpen, haClose));
      haLow=MathMin(maLow, MathMin(haOpen, haClose));
      if (haOpen<haClose)
        {
         ExtMapBuffer1[pos]=haLow;
         ExtMapBuffer2[pos]=haHigh;
        }
      else
        {
         ExtMapBuffer1[pos]=haHigh;
         ExtMapBuffer2[pos]=haLow;
        }
      ExtMapBuffer3[pos]=haOpen;
      ExtMapBuffer4[pos]=haClose;
 	   pos--;
     }
//----
   return(0);
  }
//+------------------------------------------------------------------+
Comments