Heiken_Ashi_Ma_2009
Download script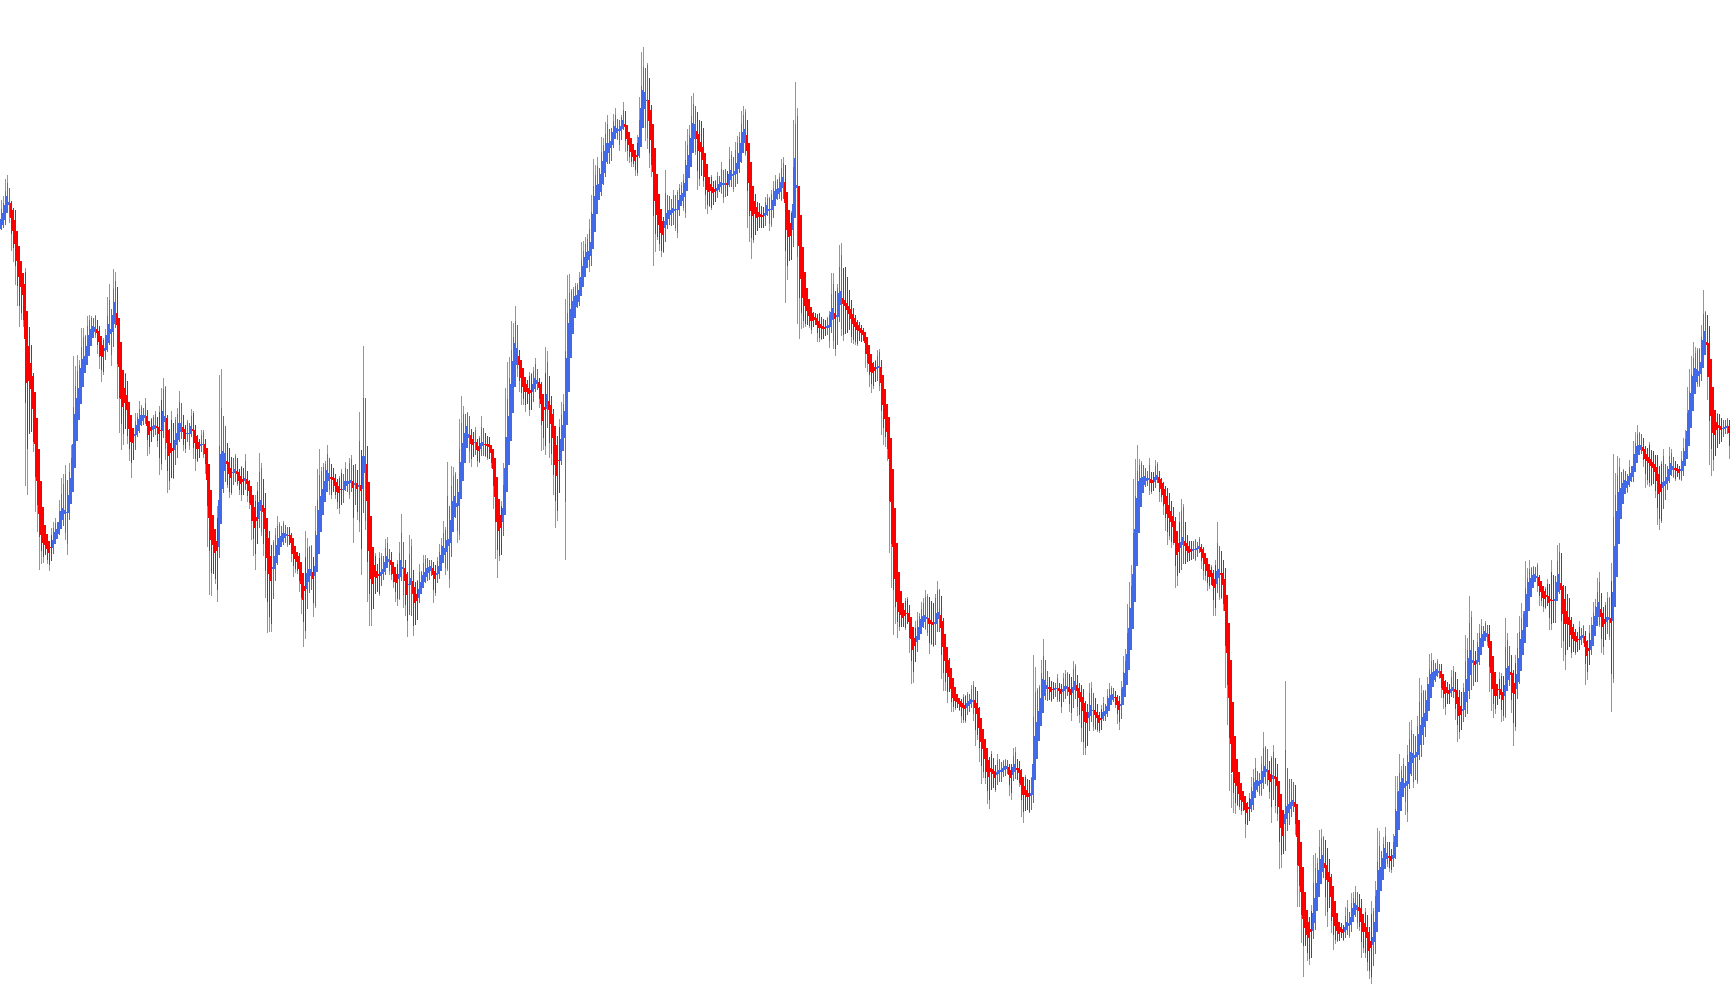
This tool is designed to provide traders with a smoothed, visually clear representation of price action on their trading charts. It combines two well-known market analysis concepts: Heiken Ashi candles and Moving Averages. By blending these two methodologies, the script aims to filter out "market noise"—the small, erratic price fluctuations that can often lead to false signals—allowing for a clearer view of the prevailing trend.
How the Logic Works
The indicator functions by performing a multi-step calculation on historical price data to generate customized visual elements:
1. Data Smoothing (Moving Averages) Instead of looking at the raw, jagged price of every individual candle, the script first processes the market data through a Moving Average filter. It calculates four distinct averages based on the period and method defined by the user:
- The average Opening prices
- The average Closing prices
- The average Highs
- The average Lows
2. Heiken Ashi Synthesis The script then takes these smoothed averages and applies "Heiken Ashi" logic. In traditional charting, Heiken Ashi candles represent the average price movement over time. This script calculates a specialized "Open" and "Close" for these synthetic candles by averaging the previous data points and combining the current smoothed price extremes.
3. Dynamic Range Determination To determine the visual boundaries of the bars, the logic compares the calculated Heiken Ashi values. It identifies the highest and lowest points among the processed data to ensure that the resulting visual representation accurately reflects the volatility of the smoothed trend while remaining cohesive and fluid.
Visual Output
The final result is displayed on your chart as a series of colored histograms. These bars are programmed to react to the momentum of the market:
- Color Transitions: The script uses specific color shifts (such as Red and Royal Blue) to signify different directional movements.
- Trend Clarity: By smoothing the price action first, the bars help traders identify whether the current momentum is bullish or bearish more effectively than standard candles might allow.
Summary for the Trader
In short, this script acts as a "lens" over your chart. It takes raw market data, smooths it out using moving averages to remove distractions, and then redraws it into a Heiken Ashi format. This provides a cleaner visual experience that helps you stay aligned with the long-term trend while ignoring temporary price spikes.
//+------------------------------------------------------------------+
//|                                               Heiken Ashi Ma.mq4 |
//+------------------------------------------------------------------+
//|                                                      mod by Raff |
//+------------------------------------------------------------------+
#property copyright "Copyright © 2006, Forex-TSD.com "
#property link      "http://www.forex-tsd.com/"

#property indicator_chart_window
#property indicator_buffers 4
#property indicator_color1 DarkOrange
#property indicator_color2 Turquoise
#property indicator_color3 Red
#property indicator_color4 RoyalBlue
//---- parameters
extern int MaMetod  = 1;
extern int MaPeriod = 3;
//---- buffers
double ExtMapBuffer1[];
double ExtMapBuffer2[];
double ExtMapBuffer3[];
double ExtMapBuffer4[];
//----
int ExtCountedBars=0;
//+------------------------------------------------------------------+
//| Custom indicator initialization function                         |
//|------------------------------------------------------------------|
int init()
  {
//---- indicators
   SetIndexStyle(0,DRAW_HISTOGRAM, 0, 1, Red);
   SetIndexBuffer(0, ExtMapBuffer1);
   SetIndexStyle(1,DRAW_HISTOGRAM, 0, 1, RoyalBlue);
   SetIndexBuffer(1, ExtMapBuffer2);
   SetIndexStyle(2,DRAW_HISTOGRAM, 0, 3, Red);
   SetIndexBuffer(2, ExtMapBuffer3);
   SetIndexStyle(3,DRAW_HISTOGRAM, 0, 3, RoyalBlue);
   SetIndexBuffer(3, ExtMapBuffer4);
//----
   SetIndexDrawBegin(0,5);
//---- indicator buffers mapping
   SetIndexBuffer(0,ExtMapBuffer1);
   SetIndexBuffer(1,ExtMapBuffer2);
   SetIndexBuffer(2,ExtMapBuffer3);
   SetIndexBuffer(3,ExtMapBuffer4);
//---- initialization done
   return(0);
  }
//+------------------------------------------------------------------+
//| Custor indicator deinitialization function                       |
//+------------------------------------------------------------------+
int deinit()
  {
//---- TODO: add your code here

//----
   return(0);
  }
//+------------------------------------------------------------------+
//| Custom indicator iteration function                              |
//+------------------------------------------------------------------+
int start()
  {
   double maOpen, maClose, maLow, maHigh;
   double haOpen, haHigh, haLow, haClose;
   if(Bars<=10) return(0);
   ExtCountedBars=IndicatorCounted();
//---- check for possible errors
   if (ExtCountedBars<0) return(-1);
//---- last counted bar will be recounted
   if (ExtCountedBars>0) ExtCountedBars--;
   int pos=Bars-ExtCountedBars-1;
   while(pos>=0)
     {
      maOpen  = iMA(NULL,0,MaPeriod,0,MaMetod,PRICE_OPEN ,pos);
      maClose = iMA(NULL,0,MaPeriod,0,MaMetod,PRICE_CLOSE,pos);
      maLow   = iMA(NULL,0,MaPeriod,0,MaMetod,PRICE_LOW  ,pos);
      maHigh  = iMA(NULL,0,MaPeriod,0,MaMetod,PRICE_HIGH ,pos);

      haOpen=(ExtMapBuffer3[pos+1]+ExtMapBuffer4[pos+1])/2;
      haClose=(maOpen+maHigh+maLow+maClose)/4;
      haHigh=MathMax(maHigh, MathMax(haOpen, haClose));
      haLow=MathMin(maLow, MathMin(haOpen, haClose));
      if (haOpen<haClose)
        {
         ExtMapBuffer1[pos]=haLow;
         ExtMapBuffer2[pos]=haHigh;
        }
      else
        {
         ExtMapBuffer1[pos]=haHigh;
         ExtMapBuffer2[pos]=haLow;
        }
      ExtMapBuffer3[pos]=haOpen;
      ExtMapBuffer4[pos]=haClose;
 	   pos--;
     }
//----
   return(0);
  }
//+------------------------------------------------------------------+
Comments