MaksiGen_Range_Move_v2
Download script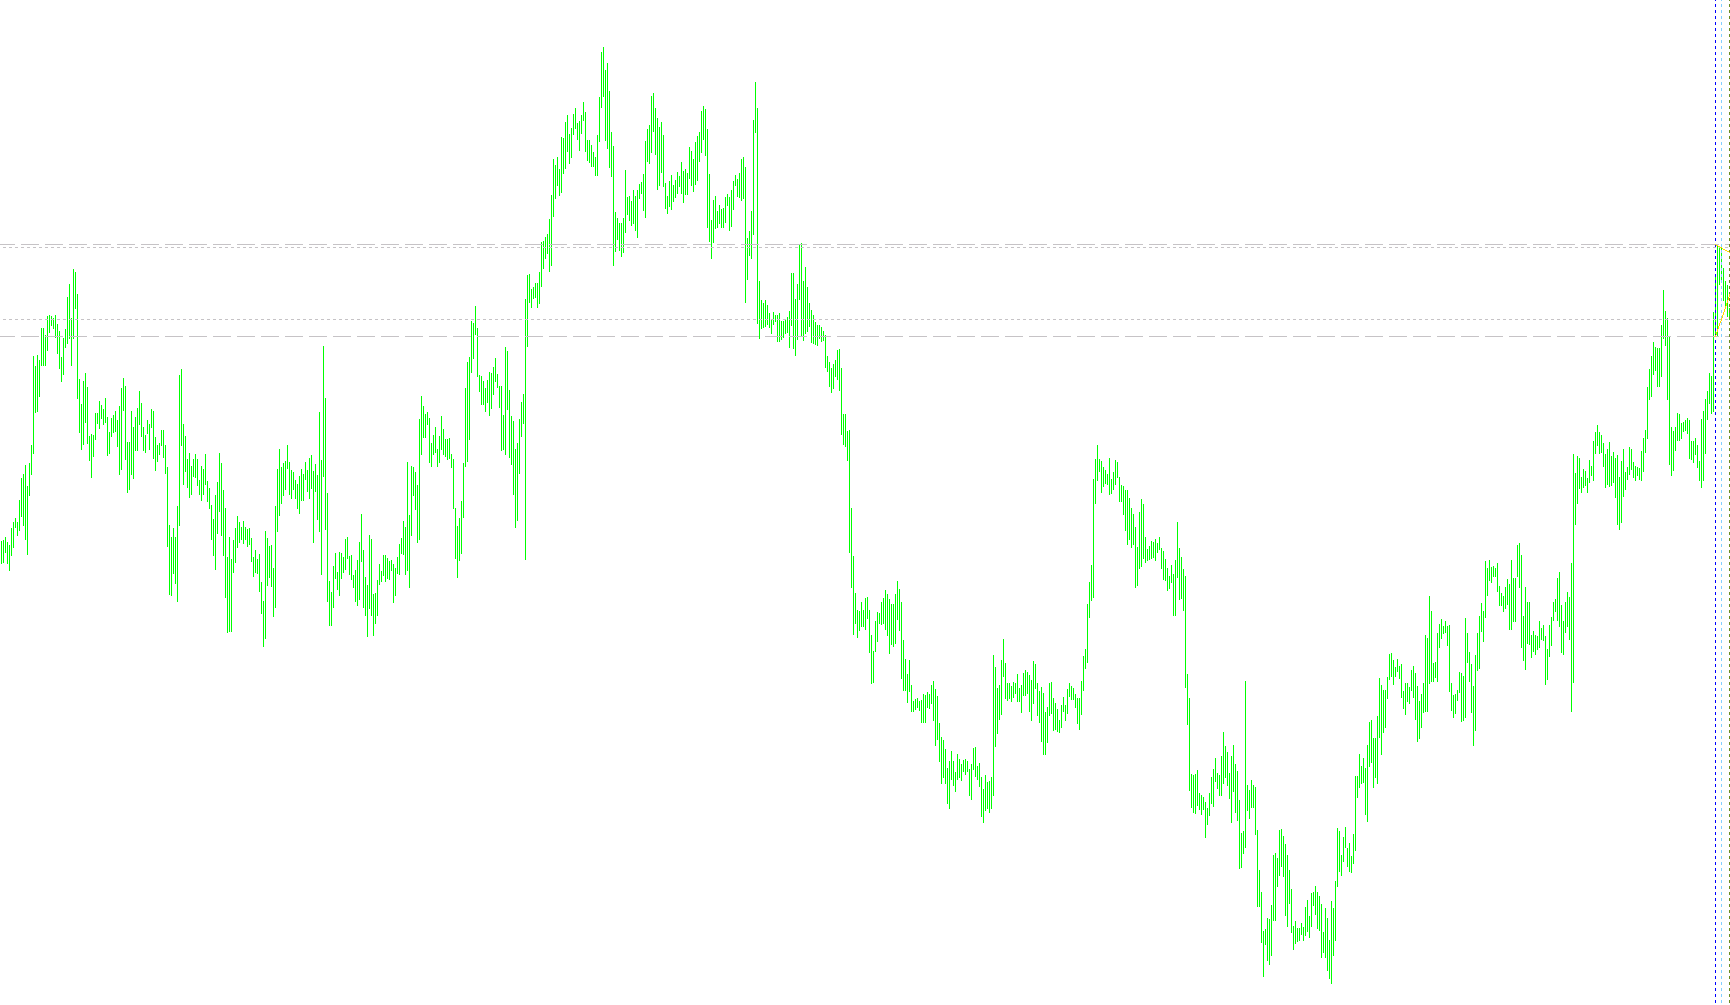
The MaksiGen Range Move script is a visual trading tool designed to help traders identify specific price action patterns and potential entry points based on historical volatility. Rather than relying on complex mathematical formulas, the logic focuses on identifying "equilibrium" between two different time horizons to find high-probability breakout zones.
How the Logic Works
The script operates by comparing two distinct windows of market activity simultaneously: a "Fast" short-term window and a "Slow" medium-term window. Here is the step-by-step breakdown of its logic:
1. Dynamic Range Identification The tool constantly scans the recent price history to find the highest highs and lowest lows for both the fast and slow periods. It plots these as visual boundaries on your chart. This allows you to see exactly how much the market has moved over the last few candles versus a slightly larger look-back period.
2. The Equilibrium Check (The Core Logic) The primary "brain" of this script is a comparison check. It looks to see if the price range of the short-term window is identical in size to the price range of the medium-term window.
- If these two ranges are equal, it suggests that the market is currently moving in a synchronized fashion, creating a structured environment suitable for a breakout.
3. Automated Level Plotting When this synchronization (equilibrium) is detected, the script automatically calculates and draws specific "Stop" levels on your chart:
- Buy Stop Level: This is placed above the recent high plus a multiplier of the current range. It tells you where the price needs to break out to confirm upward momentum.
- Sell Stop Level: This is placed below the recent low minus a multiplier of the current range. It identifies the point where a downward breakout becomes valid.
4. Visual Trend Mapping To help you stay oriented with the market's direction, the script draws trend lines connecting the highs and lows of these two windows. These lines act as visual guides to help you see if the price is expanding, contracting, or consolidating relative to the historical data it is processing.
Summary for the Trader
In simple terms, this tool filters out the "noise" by only reacting when the current short-term market volatility matches the medium-term volatility. When that balance is hit, it instantly highlights exactly where you should look for a breakout—providing you with clear "Buy" and "Sell" zones based on the market's own internal rhythm.
//+------------------------------------------------------------------+
//|                                          MaksiGen_Range_Move.mq4 |
//|                MaksiGen - MT3 by OlegVS ( olegvs2003@yahoo.com ) |
//|                                                                  |
//+------------------------------------------------------------------+
#property copyright "MaksiGen - MT3 by OlegVS ( olegvs2003@yahoo.com )"
#property link      ""

#property indicator_chart_window
//---- input parameters
extern int Pfast=5;
extern int Pslow=8;
extern double K_RangeOpen=1.4;
double hi1,lo1,hi2,lo2,Range;
//+------------------------------------------------------------------+
//| Custom indicator initialization function                         |
//+------------------------------------------------------------------+
int init()
  {
//---- Object
ObjectCreate("hi1",OBJ_HLINE,0,0,0,0,0,0,0); ObjectSet("hi1",OBJPROP_COLOR,Silver); ObjectSet("hi1",OBJPROP_STYLE,STYLE_DOT);
ObjectCreate("lo1",OBJ_HLINE,0,0,0,0,0,0,0); ObjectSet("lo1",OBJPROP_COLOR,Silver); ObjectSet("lo1",OBJPROP_STYLE,STYLE_DOT);
ObjectCreate("hi2",OBJ_HLINE,0,0,0,0,0,0,0); ObjectSet("hi2",OBJPROP_COLOR,Silver); ObjectSet("hi2",OBJPROP_STYLE,STYLE_DASH);
ObjectCreate("lo2",OBJ_HLINE,0,0,0,0,0,0,0); ObjectSet("lo2",OBJPROP_COLOR,Silver); ObjectSet("lo2",OBJPROP_STYLE,STYLE_DASH);

ObjectCreate("Bar#1",    OBJ_VLINE,0,0,0,0,0,0,0); ObjectSet("Bar#1",    OBJPROP_COLOR,OliveDrab);    ObjectSet("Bar#1",    OBJPROP_STYLE,STYLE_DOT);
ObjectCreate("Bar#Pfast",OBJ_VLINE,0,0,0,0,0,0,0); ObjectSet("Bar#Pfast",OBJPROP_COLOR,LightSkyBlue); ObjectSet("Bar#Pfast",OBJPROP_STYLE,STYLE_DOT);
ObjectCreate("Bar#Pslow",OBJ_VLINE,0,0,0,0,0,0,0); ObjectSet("Bar#Pslow",OBJPROP_COLOR,Blue);         ObjectSet("Bar#Pslow",OBJPROP_STYLE,STYLE_DOT);

ObjectCreate("TrendHIGH",OBJ_TREND,0,0,0,0,0,0); ObjectSet("TrendHIGH",OBJPROP_COLOR,Gold); ObjectSet("TrendHIGH",OBJPROP_STYLE,STYLE_SOLID);
ObjectCreate("Trend_LOW",OBJ_TREND,0,0,0,0,0,0); ObjectSet("Trend_LOW",OBJPROP_COLOR,Gold); ObjectSet("Trend_LOW",OBJPROP_STYLE,STYLE_SOLID);

ObjectCreate("SELLSTOP",OBJ_HLINE,0,0,0,0,0,0,0); ObjectSet("SELLSTOP",OBJPROP_COLOR,Red);  ObjectSet("SELLSTOP",OBJPROP_STYLE,STYLE_DOT);
ObjectCreate("BUY_STOP",OBJ_HLINE,0,0,0,0,0,0,0); ObjectSet("BUY_STOP",OBJPROP_COLOR,Blue); ObjectSet("BUY_STOP",OBJPROP_STYLE,STYLE_DOT);
//----
   return(0);
  }
//+------------------------------------------------------------------+
//| Custor indicator deinitialization function                       |
//+------------------------------------------------------------------+
int deinit()
  {
//----
ObjectDelete("hi1"); ObjectDelete("lo1");
ObjectDelete("hi2"); ObjectDelete("lo2");
ObjectDelete("Bar#1"); ObjectDelete("Bar#Pfast"); ObjectDelete("Bar#Pslow");
ObjectDelete("TrendHIGH"); ObjectDelete("Trend_LOW");
//----
   return(0);
  }
//+------------------------------------------------------------------+
//| Custom indicator iteration function                              |
//+------------------------------------------------------------------+
int start()
{
//----
hi1=High[Highest(Symbol(),0,MODE_HIGH,Pfast,1)];
lo1=Low[Lowest(Symbol(),0,MODE_LOW,Pfast,1)];
hi2=High[Highest(Symbol(),0,MODE_HIGH,Pslow,1)];
lo2=Low[Lowest(Symbol(),0,MODE_LOW,Pslow,1)];
//---- ãîðèçîíòàëüíûå ëèíèè
ObjectMove("hi1",0,Time[Pfast-1],hi1);
ObjectMove("lo1",0,Time[Pfast-1],lo1);
ObjectMove("hi2",0,Time[Pslow-1],hi2);
ObjectMove("lo2",0,Time[Pslow-1],lo2);
//---- âåðòèêàëüíûå ëèíèè
ObjectMove("Bar#1",    0,Time[1],    High[1]);
ObjectMove("Bar#Pfast",0,Time[Pfast],High[1]);
ObjectMove("Bar#Pslow",0,Time[Pslow],High[1]);
//---- òðåíäîâûå ëèíèè
ObjectSet("TrendHIGH",OBJPROP_TIME1,Time[Pslow]); ObjectSet("TrendHIGH",OBJPROP_PRICE1,hi2);
ObjectSet("TrendHIGH",OBJPROP_TIME2,Time[Pfast]); ObjectSet("TrendHIGH",OBJPROP_PRICE2,hi1);

ObjectSet("Trend_LOW",OBJPROP_TIME1,Time[Pslow]); ObjectSet("Trend_LOW",OBJPROP_PRICE1,lo2);
ObjectSet("Trend_LOW",OBJPROP_TIME2,Time[Pfast]); ObjectSet("Trend_LOW",OBJPROP_PRICE2,lo1);

if (hi1-lo1==hi2-lo2)
{
Range=(hi1-lo1)*K_RangeOpen;
ObjectMove("SELLSTOP",0,Time[Pfast-1],lo1-Range);
ObjectMove("BUY_STOP",0,Time[Pfast-1],hi1+Range);

ObjectSet("TrendHIGH",OBJPROP_TIME1,Time[Pslow-1]); ObjectSet("TrendHIGH",OBJPROP_PRICE1,hi2);
ObjectSet("TrendHIGH",OBJPROP_TIME2,Time[Pfast-1]); ObjectSet("TrendHIGH",OBJPROP_PRICE2,hi1);

ObjectSet("Trend_LOW",OBJPROP_TIME1,Time[Pslow]-1); ObjectSet("Trend_LOW",OBJPROP_PRICE1,lo2);
ObjectSet("Trend_LOW",OBJPROP_TIME2,Time[Pfast]-1); ObjectSet("Trend_LOW",OBJPROP_PRICE2,lo1);
}

ObjectsRedraw();

return(0);
}
//+------------------------------------------------------------------+
Comments