LSMA_Channelv2
Download script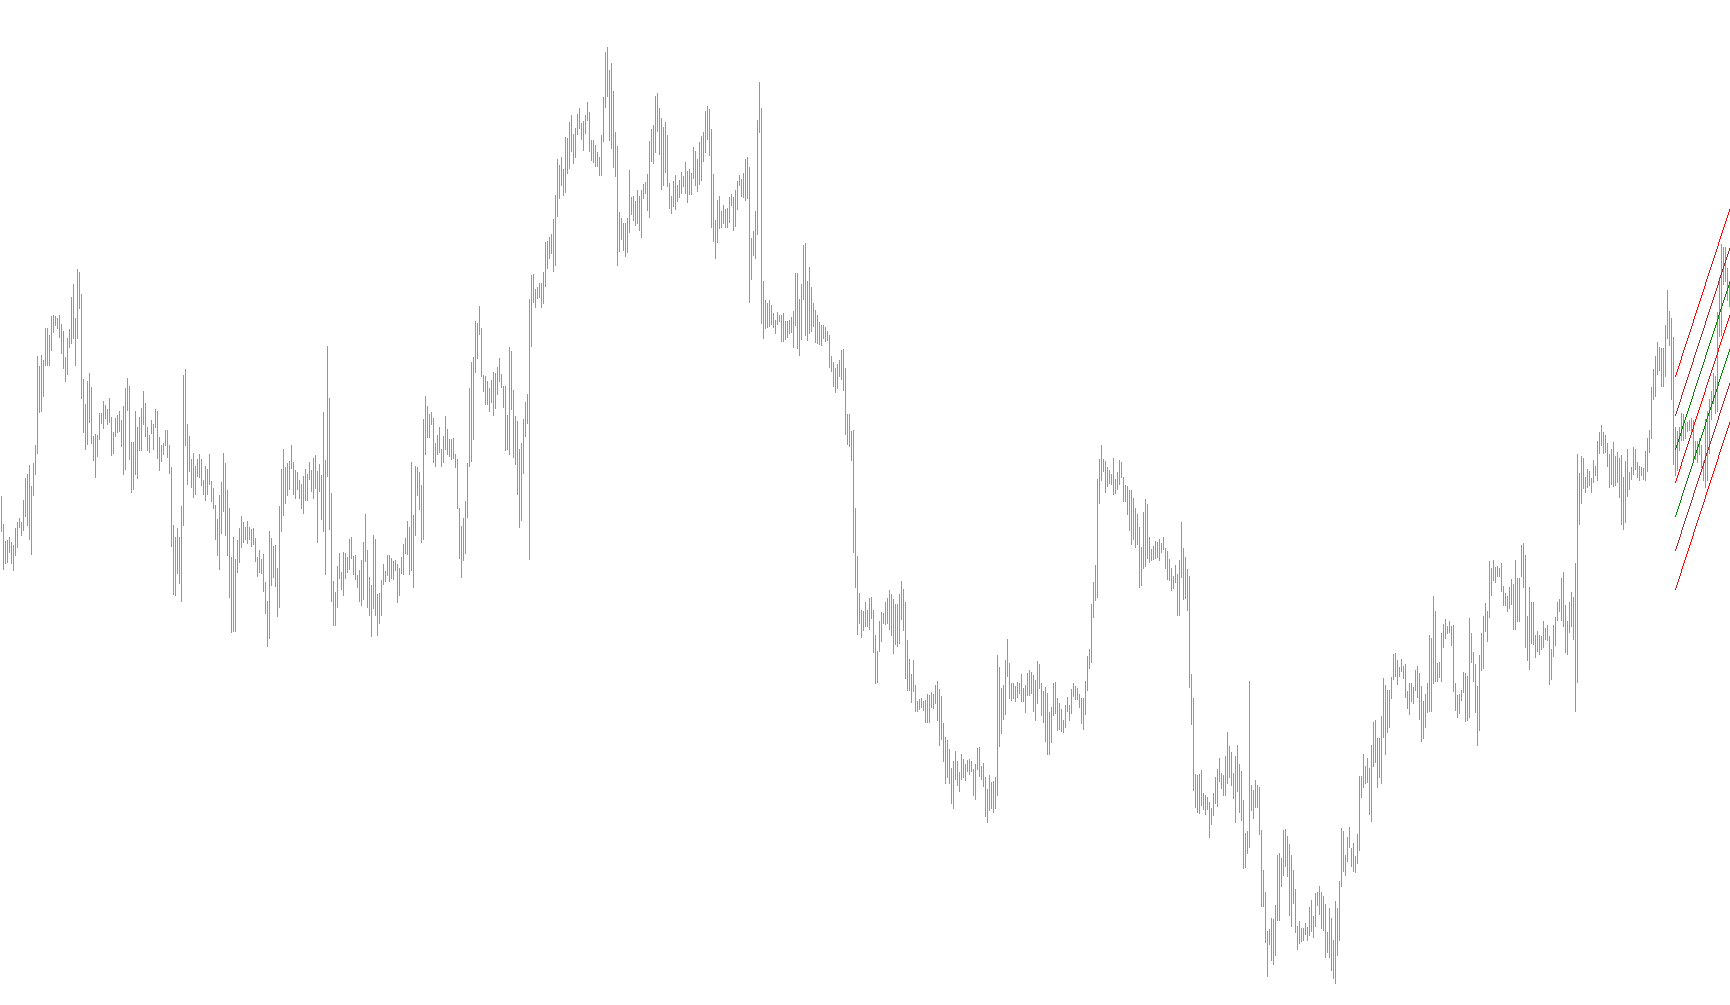
This script functions as a sophisticated visual tool for technical analysis, designed to help traders visualize price trends and volatility by drawing a mathematical "Regression Channel" directly on a trading chart.
Core Concept
The primary logic of this tool is based on statistical regression. Instead of just following the price closely like a standard moving average, it calculates a "best-fit" line—essentially identifying the overall direction of the market over a specific period of time. Think of it as finding the straightest path that most accurately connects all the recent price points.
How the Logic Works
The script processes information in three main stages:
1. Trend Identification (The Center Line) The tool looks back at a user-defined number of past candles (the period) and analyzes the prices. It calculates two main mathematical values:
- The Slope: The angle or steepness of the trend.
- The Intercept: The starting point from which that slope begins. Using these, it draws a solid central line on your chart representing the "average" path of the price.
2. Volatility Measurement (Standard Deviation) Once the script knows the general trend, it measures how much the actual price "wiggles" or deviates away from that center line. This is known as standard deviation. By calculating this variance, the tool can determine if the market is currently behaving calmly or experiencing high-intensity fluctuations.
3. Channel Construction (The Boundaries) Using the volatility data gathered in the previous step, the script automatically draws four distinct sets of boundaries around the center trend line:
- Inside Channels: These are tight boundaries that represent the "normal" trading zone. When prices stay within these lines, the market is following its established trend with low volatility.
- Outside Channels: These wider boundaries mark a significant departure from the norm. They indicate areas where the price is moving further away from the average trend.
- Outside2 Channels: These are extreme boundaries designed to highlight "overextended" price action, showing levels that represent very high volatility or potential exhaustion points.
User Application
For a trader, this script provides a clear visual map of market behavior. It allows you to see at a glance whether the price is:
- Trending: Moving consistently along the central regression line.
- Expanding/Contracting: Getting wider (more volatile) or narrower (more stable).
- Overextended: Pushing into the outer "Outside" zones, which can often signal that a trend is becoming overstretched and may be due for a correction or a reversal.
/*-----------------------------+
|			       |
| Shared by www.Aptrafx.com    |
|			       |
+------------------------------*/

//+------------------------------------------------------------------+
//|                                                 LSMA_Channel.mq4 |
//|                      Copyright © 2005, MetaQuotes Software Corp. |
//|                                       http://www.metaquotes.net/ |
//+------------------------------------------------------------------+
#property copyright "Copyright © 2005, MetaQuotes Software Corp."
#property link      "http://www.metaquotes.net/"

#property indicator_chart_window
//---- indicator parameters
extern int    IdNum   = 1;
extern int    RPeriod = 28;
extern color  MidColor = Red;
extern int    LineWeight   = 1;
extern int    PriceVal = 0;         // 0 = Close, 1 = Low, 2 = High
extern double StDevOutside2 = 2.55;
extern color Outside2 = Red;
extern double StDevOutside = 1.618;
extern color Outside = Brown;
extern double StDevInside = 0.809;
extern color Inside = Green;

//+------------------------------------------------------------------+
//| Custom indicator initialization function                         |
//+------------------------------------------------------------------+
int init()
  {
//----
  ObjectCreate("Reg_line"+IdNum, OBJ_TREND, 0, 0,0, 0,0);
	ObjectSet("Reg_line"+IdNum, OBJPROP_COLOR, MidColor);
 	ObjectSet("Reg_line"+IdNum, OBJPROP_STYLE, STYLE_SOLID);
 	ObjectSet("Reg_line"+IdNum, OBJPROP_WIDTH, LineWeight);
  ObjectCreate("Reg_Outside_upper" +IdNum, OBJ_TREND, 0, 0,0, 0,0);
	ObjectSet("Reg_Outside_upper"+IdNum, OBJPROP_COLOR, Outside);
 	ObjectSet("Reg_Outside_upper"+IdNum, OBJPROP_STYLE, STYLE_SOLID);
 	ObjectSet("Reg_Outside_upper"+IdNum, OBJPROP_WIDTH, LineWeight);
  ObjectCreate("Reg_Outside_lower" +IdNum, OBJ_TREND, 0, 0,0, 0,0);
 	ObjectSet("Reg_Outside_lower"+IdNum, OBJPROP_COLOR, Outside);
 	ObjectSet("Reg_Outside_lower"+IdNum, OBJPROP_STYLE, STYLE_SOLID);
 	ObjectSet("Reg_Outside_lower"+IdNum, OBJPROP_WIDTH, LineWeight);
  ObjectCreate("Reg_Inside_upper" +IdNum, OBJ_TREND, 0, 0,0, 0,0);
	ObjectSet("Reg_Inside_upper"+IdNum, OBJPROP_COLOR, Inside);
 	ObjectSet("Reg_Inside_upper"+IdNum, OBJPROP_STYLE, STYLE_SOLID);
 	ObjectSet("Reg_Inside_upper"+IdNum, OBJPROP_WIDTH, LineWeight);
  ObjectCreate("Reg_Inside_lower" +IdNum, OBJ_TREND, 0, 0,0, 0,0);
 	ObjectSet("Reg_Inside_lower"+IdNum, OBJPROP_COLOR, Inside);
 	ObjectSet("Reg_Inside_lower"+IdNum, OBJPROP_STYLE, STYLE_SOLID);
 	ObjectSet("Reg_Inside_lower"+IdNum, OBJPROP_WIDTH, LineWeight);
  ObjectCreate("Reg_Outside2_upper" +IdNum, OBJ_TREND, 0, 0,0, 0,0);
	ObjectSet("Reg_Outside2_upper"+IdNum, OBJPROP_COLOR, Outside2);
 	ObjectSet("Reg_Outside2_upper"+IdNum, OBJPROP_STYLE, STYLE_SOLID);
 	ObjectSet("Reg_Outside2_upper"+IdNum, OBJPROP_WIDTH, LineWeight);
  ObjectCreate("Reg_Outside2_lower" +IdNum, OBJ_TREND, 0, 0,0, 0,0);
 	ObjectSet("Reg_Outside2_lower"+IdNum, OBJPROP_COLOR, Outside2);
 	ObjectSet("Reg_Outside2_lower"+IdNum, OBJPROP_STYLE, STYLE_SOLID);
 	ObjectSet("Reg_Outside2_lower"+IdNum, OBJPROP_WIDTH, LineWeight);

  Comment("Regression channel");
   return(0);
  }

//+------------------------------------------------------------------+
//| Custor indicator deinitialization function                       |
//+------------------------------------------------------------------+
void deinit() {
  ObjectDelete("Reg_line"+IdNum);
  ObjectDelete("Reg_Outside_upper" +IdNum);
  ObjectDelete("Reg_Outside_lower" +IdNum);
  ObjectDelete("Reg_Inside_upper" +IdNum);
  ObjectDelete("Reg_Inside_lower" +IdNum);
  ObjectDelete("Reg_Outside2_upper" +IdNum);
  ObjectDelete("Reg_Outside2_lower" +IdNum);
  Comment("");
}

//+------------------------------------------------------------------+
//| Regression Line                                                  |
//+------------------------------------------------------------------+
int start()
  {
   double y1,y2, price;
   double sum_xy, sum_x, sum_y, sum_x2, a, b;
   double stddiv, tmp_div;
   double x_n_upOut, x_1_upOut, x_n_downOut, x_1_downOut;
   double x2_n_upOut, x2_1_upOut, x2_n_downOut, x2_1_downOut;
   double x_n_upIn, x_1_upIn, x_n_downIn, x_1_downIn;
   int x, n;

//----
   if(Bars<=RPeriod) return(0);

// Initialize summations

   sum_xy = 0;
   sum_x = 0;
   sum_y = 0;
   sum_x2 = 0;
   a = 0;
   b = 0;
   y1 = 0;
   y2 = 0;
   tmp_div = 0;
   n = RPeriod;

// Calculate sums

  	for(x=RPeriod;x>0;x--)
  	{
  	  switch (PriceVal)
  	  {
  	     case 0: price = Close[x];
  	             break;
  	     case 1: price = Low[x];
  	             break;
  	     case 2: price = High[x];
  	             break;
  	  }
     sum_xy = sum_xy + x*price;
     sum_x = sum_x + x;
     sum_y = sum_y + price;
     sum_x2 = sum_x2 + x*x;
  }

// Calculate slope b and intercept a

  b = (n*sum_xy - sum_x*sum_y)/(n*sum_x2 - sum_x*sum_x);
  a = (sum_y - b*sum_x)/n;

// Calculate endpoints for least squares line

  y1 = a + b*n;
  y2 = a + b;

// Plot the line

 	ObjectSet("Reg_line"+IdNum, OBJPROP_TIME1, Time[RPeriod]);
 	ObjectSet("Reg_line"+IdNum, OBJPROP_TIME2, Time[0]);
 	ObjectSet("Reg_line"+IdNum, OBJPROP_PRICE1, y1);
 	ObjectSet("Reg_line"+IdNum, OBJPROP_PRICE2, y2);

// Calculate the standard deviations of the line

  for (x=RPeriod; x>0; x--) {
  	  switch (PriceVal)
  	  {
  	     case 0: price = Close[x];
  	             break;
  	     case 1: price = Low[x];
  	             break;
  	     case 2: price = High[x];
  	             break;
  	  }

  	tmp_div = tmp_div + (price - (a + b*x))*(price - (a + b*x));
  }

  stddiv = MathSqrt(tmp_div/n);

  x_n_upOut = y1 + StDevOutside*stddiv;
  x_1_upOut = y2 + StDevOutside*stddiv;

  x_n_downOut = y1 - StDevOutside*stddiv;
  x_1_downOut = y2 - StDevOutside*stddiv;

  x_n_upIn = y1 + StDevInside*stddiv;
  x_1_upIn = y2 + StDevInside*stddiv;

  x_n_downIn = y1 - StDevInside*stddiv;
  x_1_downIn = y2 - StDevInside*stddiv;

  x2_n_upOut = y1 + StDevOutside2*stddiv;
  x2_1_upOut = y2 + StDevOutside2*stddiv;

  x2_n_downOut = y1 - StDevOutside2*stddiv;
  x2_1_downOut = y2 - StDevOutside2*stddiv;

// Plot the standard deviation lines

// OUTSIDE
  //upper
 	ObjectSet("Reg_Outside_upper"+IdNum, OBJPROP_TIME1, Time[RPeriod]);
 	ObjectSet("Reg_Outside_upper"+IdNum, OBJPROP_TIME2, Time[0]);
 	ObjectSet("Reg_Outside_upper"+IdNum, OBJPROP_PRICE1, x_n_upOut);
 	ObjectSet("Reg_Outside_upper"+IdNum, OBJPROP_PRICE2, x_1_upOut);
  //lower
 	ObjectSet("Reg_Outside_lower"+IdNum, OBJPROP_TIME1, Time[RPeriod]);
 	ObjectSet("Reg_Outside_lower"+IdNum, OBJPROP_TIME2, Time[0]);
 	ObjectSet("Reg_Outside_lower"+IdNum, OBJPROP_PRICE1, x_n_downOut);
 	ObjectSet("Reg_Outside_lower"+IdNum, OBJPROP_PRICE2, x_1_downOut);

// OUTSIDE2
  //upper
 	ObjectSet("Reg_Outside2_upper"+IdNum, OBJPROP_TIME1, Time[RPeriod]);
 	ObjectSet("Reg_Outside2_upper"+IdNum, OBJPROP_TIME2, Time[0]);
 	ObjectSet("Reg_Outside2_upper"+IdNum, OBJPROP_PRICE1, x2_n_upOut);
 	ObjectSet("Reg_Outside2_upper"+IdNum, OBJPROP_PRICE2, x2_1_upOut);
  //lower
 	ObjectSet("Reg_Outside2_lower"+IdNum, OBJPROP_TIME1, Time[RPeriod]);
 	ObjectSet("Reg_Outside2_lower"+IdNum, OBJPROP_TIME2, Time[0]);
 	ObjectSet("Reg_Outside2_lower"+IdNum, OBJPROP_PRICE1, x2_n_downOut);
 	ObjectSet("Reg_Outside2_lower"+IdNum, OBJPROP_PRICE2, x2_1_downOut);

//INSIDE
  //upper
 	ObjectSet("Reg_Inside_upper"+IdNum, OBJPROP_TIME1, Time[RPeriod]);
 	ObjectSet("Reg_Inside_upper"+IdNum, OBJPROP_TIME2, Time[0]);
 	ObjectSet("Reg_Inside_upper"+IdNum, OBJPROP_PRICE1, x_n_upIn);
 	ObjectSet("Reg_Inside_upper"+IdNum, OBJPROP_PRICE2, x_1_upIn);
  //lower
 	ObjectSet("Reg_Inside_lower"+IdNum, OBJPROP_TIME1, Time[RPeriod]);
 	ObjectSet("Reg_Inside_lower"+IdNum, OBJPROP_TIME2, Time[0]);
 	ObjectSet("Reg_Inside_lower"+IdNum, OBJPROP_PRICE1, x_n_downIn);
 	ObjectSet("Reg_Inside_lower"+IdNum, OBJPROP_PRICE2, x_1_downIn);
   return(0);
  }
//+------------------------------------------------------------------+
Comments