MaksiGen_Range_Move_v1
Download script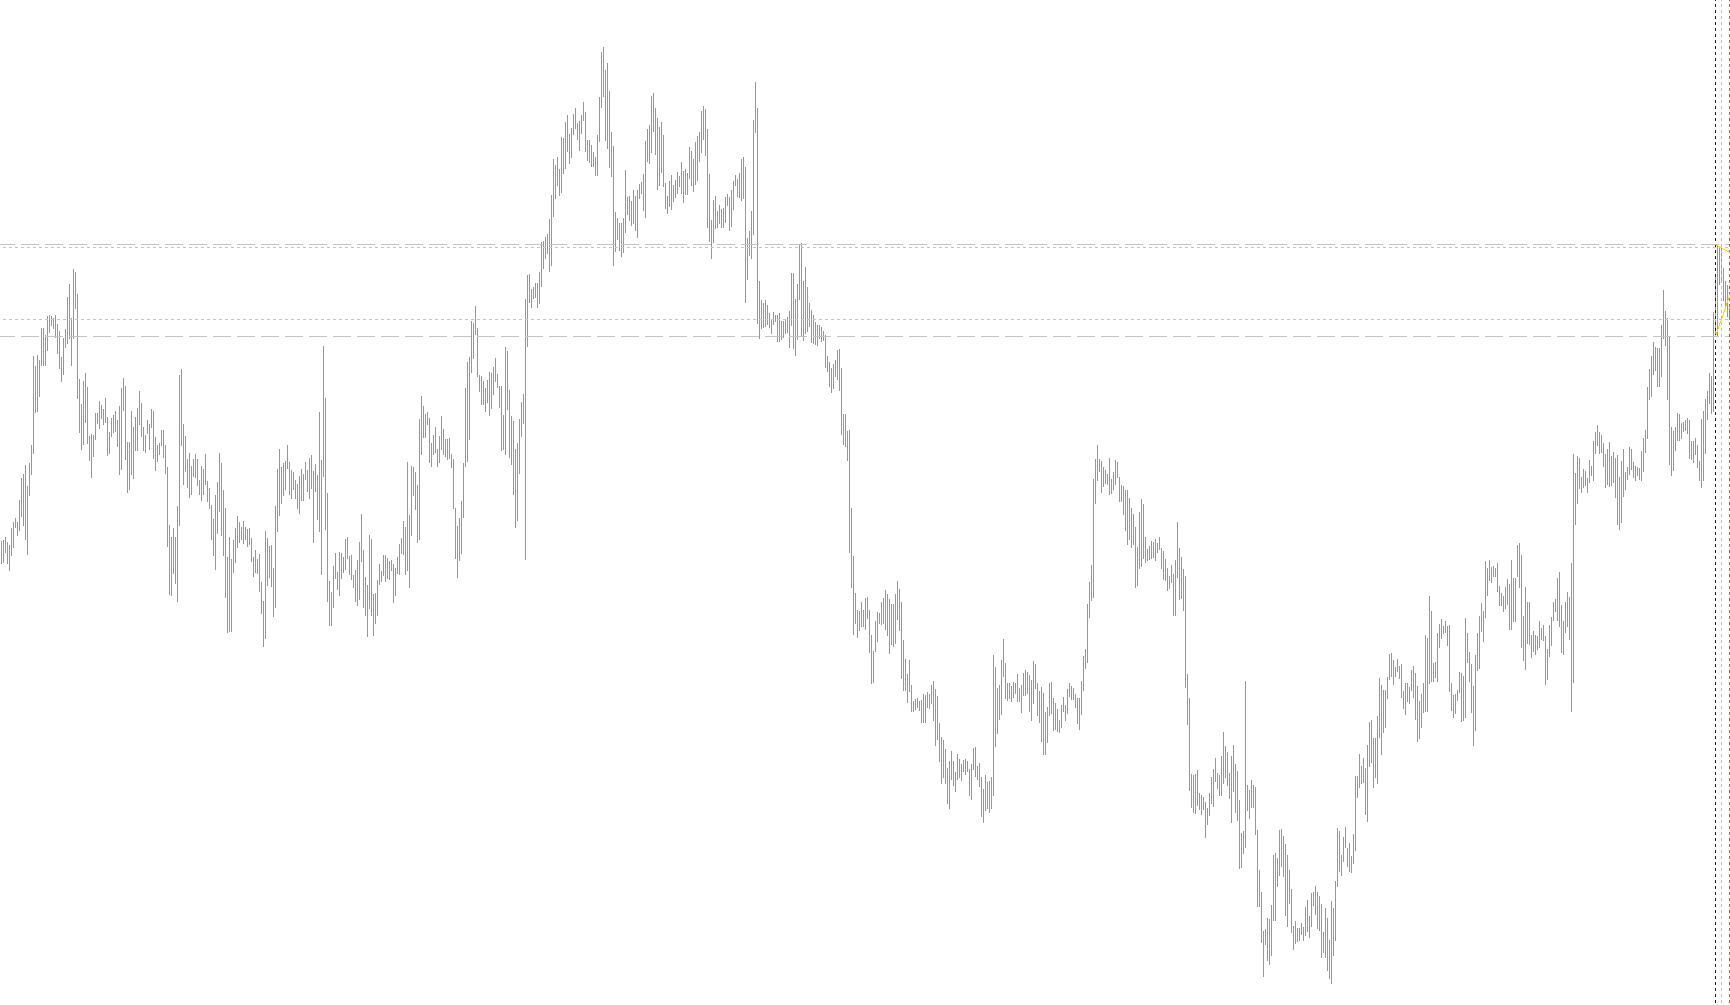
This script is designed to provide visual analysis of market price movements by identifying specific price ranges and trend behaviors on a trading chart. Rather than providing simple signals, it dynamically maps out the relationship between short-term and medium-term price volatility.
Core Logic and Functionality
The tool operates by analyzing two different "windows" of recent price history simultaneously:
- Short-Term Window: It identifies the highest and lowest prices reached over a small, immediate period.
- Medium-Term Window: It identifies the highest and lowest prices reached over a slightly larger, broader period.
By comparing these two windows, the script seeks to establish "symmetry" in the market. The underlying logic focuses on identifying moments where the price movement in the short term matches the magnitude of the price movement in the medium term.
Visual Components
To help traders interpret this data, the script automatically draws several types of markers on the chart:
- Dynamic Range Boundaries: It places horizontal lines representing the peaks and troughs of both the short-term and medium-term windows. This allows you to see exactly where the price "extremes" are occurring in real-time.
- Time Markers: Vertical lines are used to anchor the analysis to specific points in time, showing exactly which candles are being used to calculate the current ranges.
- Trend Lines: The script draws diagonal trend lines connecting the highs and lows of these two periods. These lines serve as a visual representation of the current momentum and the slope of the price movement.
Execution Logic: Identifying Opportunities
The most critical part of the script's logic occurs when it detects a specific balance between the two timeframes. If the price range of the short-term window is equal to the price range of the medium-term window, the script triggers a specific visual response:
- Projection Levels: It calculates a "Range" based on these observations and projects two horizontal lines into the future (or onto the current price action).
- Buy/Sell Stop Indicators: One line is projected above the recent high (potential Buy Stop), and one is projected below the recent low (potential Sell Stop). These act as markers for where a breakout might occur if the price continues its current momentum.
Summary for the User
Essentially, this tool acts as a visual "symmetry checker." It filters out minor market noise by comparing immediate price action against broader trends. When it finds that the current move is proportionally equal to the recent history, it highlights potential breakout points, helping you visualize where the price might head next based on the established momentum.
/*-----------------------------+
|			       |
| Shared by www.Aptrafx.com    |
|			       |
+------------------------------*/

//+------------------------------------------------------------------+
//|                                          MaksiGen_Range_Move.mq4 |
//|                MaksiGen - MT3 by OlegVS ( olegvs2003@yahoo.com ) |
//|                                                                  |
//+------------------------------------------------------------------+
#property copyright "MaksiGen - MT3 by OlegVS ( olegvs2003@yahoo.com )"
#property link      ""

#property indicator_chart_window
//---- input parameters
extern int Pfast=5;
extern int Pslow=8;
extern double K_RangeOpen=1.4;
double hi1,lo1,hi2,lo2,Range;
//+------------------------------------------------------------------+
//| Custom indicator initialization function                         |
//+------------------------------------------------------------------+
int init()
  {
//---- Object
ObjectCreate("hi1",OBJ_HLINE,0,0,0,0,0,0,0); ObjectSet("hi1",OBJPROP_COLOR,Silver); ObjectSet("hi1",OBJPROP_STYLE,STYLE_DOT);
ObjectCreate("lo1",OBJ_HLINE,0,0,0,0,0,0,0); ObjectSet("lo1",OBJPROP_COLOR,Silver); ObjectSet("lo1",OBJPROP_STYLE,STYLE_DOT);
ObjectCreate("hi2",OBJ_HLINE,0,0,0,0,0,0,0); ObjectSet("hi2",OBJPROP_COLOR,Silver); ObjectSet("hi2",OBJPROP_STYLE,STYLE_DASH);
ObjectCreate("lo2",OBJ_HLINE,0,0,0,0,0,0,0); ObjectSet("lo2",OBJPROP_COLOR,Silver); ObjectSet("lo2",OBJPROP_STYLE,STYLE_DASH);

ObjectCreate("Bar#1",    OBJ_VLINE,0,0,0,0,0,0,0); ObjectSet("Bar#1",    OBJPROP_COLOR,OliveDrab);    ObjectSet("Bar#1",    OBJPROP_STYLE,STYLE_DOT);
ObjectCreate("Bar#Pfast",OBJ_VLINE,0,0,0,0,0,0,0); ObjectSet("Bar#Pfast",OBJPROP_COLOR,LightSkyBlue); ObjectSet("Bar#Pfast",OBJPROP_STYLE,STYLE_DOT);
ObjectCreate("Bar#Pslow",OBJ_VLINE,0,0,0,0,0,0,0); ObjectSet("Bar#Pslow",OBJPROP_COLOR,Blue);         ObjectSet("Bar#Pslow",OBJPROP_STYLE,STYLE_DOT);

ObjectCreate("TrendHIGH",OBJ_TREND,0,0,0,0,0,0); ObjectSet("TrendHIGH",OBJPROP_COLOR,Gold); ObjectSet("TrendHIGH",OBJPROP_STYLE,STYLE_SOLID);
ObjectCreate("Trend_LOW",OBJ_TREND,0,0,0,0,0,0); ObjectSet("Trend_LOW",OBJPROP_COLOR,Gold); ObjectSet("Trend_LOW",OBJPROP_STYLE,STYLE_SOLID);

ObjectCreate("SELLSTOP",OBJ_HLINE,0,0,0,0,0,0,0); ObjectSet("SELLSTOP",OBJPROP_COLOR,Red);  ObjectSet("SELLSTOP",OBJPROP_STYLE,STYLE_DOT);
ObjectCreate("BUY_STOP",OBJ_HLINE,0,0,0,0,0,0,0); ObjectSet("BUY_STOP",OBJPROP_COLOR,Blue); ObjectSet("BUY_STOP",OBJPROP_STYLE,STYLE_DOT);
//----
   return(0);
  }
//+------------------------------------------------------------------+
//| Custor indicator deinitialization function                       |
//+------------------------------------------------------------------+
int deinit()
  {
//----
ObjectDelete("hi1"); ObjectDelete("lo1");
ObjectDelete("hi2"); ObjectDelete("lo2");
ObjectDelete("Bar#1"); ObjectDelete("Bar#Pfast"); ObjectDelete("Bar#Pslow");
ObjectDelete("TrendHIGH"); ObjectDelete("Trend_LOW");
//----
   return(0);
  }
//+------------------------------------------------------------------+
//| Custom indicator iteration function                              |
//+------------------------------------------------------------------+
int start()
{
//----
hi1=High[Highest(Symbol(),0,MODE_HIGH,Pfast,1)];
lo1=Low[Lowest(Symbol(),0,MODE_LOW,Pfast,1)];
hi2=High[Highest(Symbol(),0,MODE_HIGH,Pslow,1)];
lo2=Low[Lowest(Symbol(),0,MODE_LOW,Pslow,1)];
//---- horizontal lines
ObjectMove("hi1",0,Time[Pfast-1],hi1);
ObjectMove("lo1",0,Time[Pfast-1],lo1);
ObjectMove("hi2",0,Time[Pslow-1],hi2);
ObjectMove("lo2",0,Time[Pslow-1],lo2);
//---- vertical lines
ObjectMove("Bar#1",    0,Time[1],    High[1]);
ObjectMove("Bar#Pfast",0,Time[Pfast],High[1]);
ObjectMove("Bar#Pslow",0,Time[Pslow],High[1]);
//---- trend lines
ObjectSet("TrendHIGH",OBJPROP_TIME1,Time[Pslow]); ObjectSet("TrendHIGH",OBJPROP_PRICE1,hi2);
ObjectSet("TrendHIGH",OBJPROP_TIME2,Time[Pfast]); ObjectSet("TrendHIGH",OBJPROP_PRICE2,hi1);

ObjectSet("Trend_LOW",OBJPROP_TIME1,Time[Pslow]); ObjectSet("Trend_LOW",OBJPROP_PRICE1,lo2);
ObjectSet("Trend_LOW",OBJPROP_TIME2,Time[Pfast]); ObjectSet("Trend_LOW",OBJPROP_PRICE2,lo1);

if (hi1-lo1==hi2-lo2)
{
Range=(hi1-lo1)*K_RangeOpen;
ObjectMove("SELLSTOP",0,Time[Pfast-1],lo1-Range);
ObjectMove("BUY_STOP",0,Time[Pfast-1],hi1+Range);

ObjectSet("TrendHIGH",OBJPROP_TIME1,Time[Pslow-1]); ObjectSet("TrendHIGH",OBJPROP_PRICE1,hi2);
ObjectSet("TrendHIGH",OBJPROP_TIME2,Time[Pfast-1]); ObjectSet("TrendHIGH",OBJPROP_PRICE2,hi1);

ObjectSet("Trend_LOW",OBJPROP_TIME1,Time[Pslow]-1); ObjectSet("Trend_LOW",OBJPROP_PRICE1,lo2);
ObjectSet("Trend_LOW",OBJPROP_TIME2,Time[Pfast]-1); ObjectSet("Trend_LOW",OBJPROP_PRICE2,lo1);
}

ObjectsRedraw();

return(0);
}
//+------------------------------------------------------------------+
Comments