lsma(1)
Download script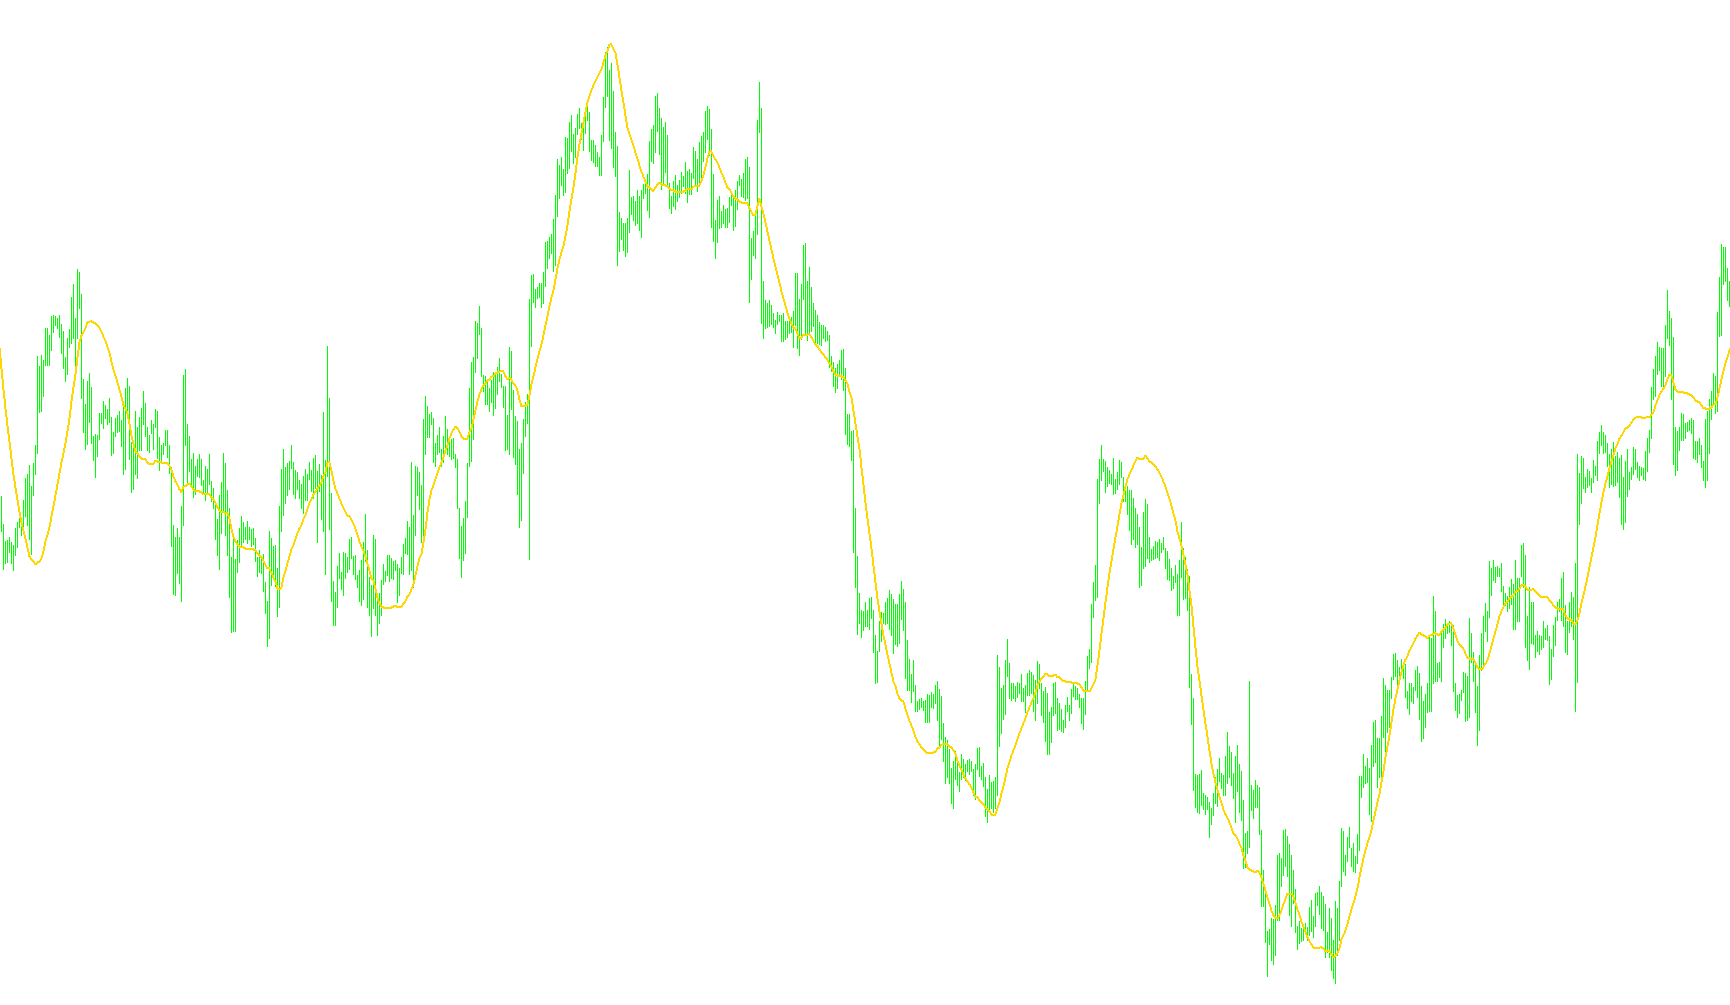
This script is designed to provide a specialized visual trend indicator for your trading charts. It calculates and displays the Least Squares Moving Average (LSMA), which is a sophisticated tool used to smooth out price fluctuations and reveal the underlying direction of a market trend.
How the Logic Works
Unlike a standard moving average—which treats all price data points in a period equally—the LSMA applies a weighted approach based on the position of each price point. Here is a breakdown of how it processes your data:
- Dynamic Weighting: The logic identifies the "center" of the selected time period. It then assigns different weights to the closing prices as they move further away from that center point. This means that prices closer to the middle of the calculation window have a more significant impact on the resulting line than prices at the very beginning or end of the period.
- Linear Regression Calculation: The script performs a mathematical "best-fit" analysis. It essentially tries to find a straight line that most accurately follows the path of price action over your chosen timeframe. By calculating the sum of these weighted distances, it creates a much more responsive trend line than traditional methods.
- Trend Identification: Because the LSMA is sensitive to the "momentum" of the price rather than just the average of the history, it is often used by traders to identify when a trend is accelerating or decelerating.
User Controls & Visuals
- Period Adjustment: You can define the look-back period (the number of candles the script analyzes at once). A smaller period will make the line react faster to current price moves, while a larger period will provide a smoother, more long-term trend view.
- Visual Display: The result is plotted directly on your main chart as a red line. This allows you to see the "smoothed" path of the market in real-time, helping you distinguish between temporary market noise and sustained price movements.
- Historical Depth: The script is configured to calculate and display this data over a significant amount of historical bars, ensuring that the trend line remains consistent as you scroll back through your past trading data.
Miscellaneous
9
Views
0
Downloads
0
Favorites
lsma(1)
// LSMA.mq4
// Least Squares Moving Average

#property link "mandorr@gmail.com"
#property indicator_chart_window
#property indicator_buffers 1
#property indicator_color1 Red

extern int period=50;
extern int CountBars=10000;   // Êîëè÷åñòâî îòîáðàæàåìûõ áàðîâ

double buffer[];

void init()
   {
   SetIndexStyle(0,DRAW_LINE,0,2);
   SetIndexBuffer(0,buffer);
   SetIndexLabel(0,"Value");
   SetIndexDrawBegin(0,0);
   }

void start()
   {
   for (int i=0; i<=CountBars-1; i++)
      {
      buffer[i]=LSMA(period,i);
      }
   }

double LSMA(int ma_period,int shift)
   {
   double lengthvar;
   double tmp;
   double sum=0;
   for (int i=ma_period; i>=1; i--)
      {
      lengthvar=(ma_period+1)/3;
      tmp=(i-lengthvar)*Close[ma_period-i+shift];
      sum+=tmp;
      }
   double value=sum*6/(ma_period*(ma_period+1));
   return (value);
   }
Comments