_linreg
Download script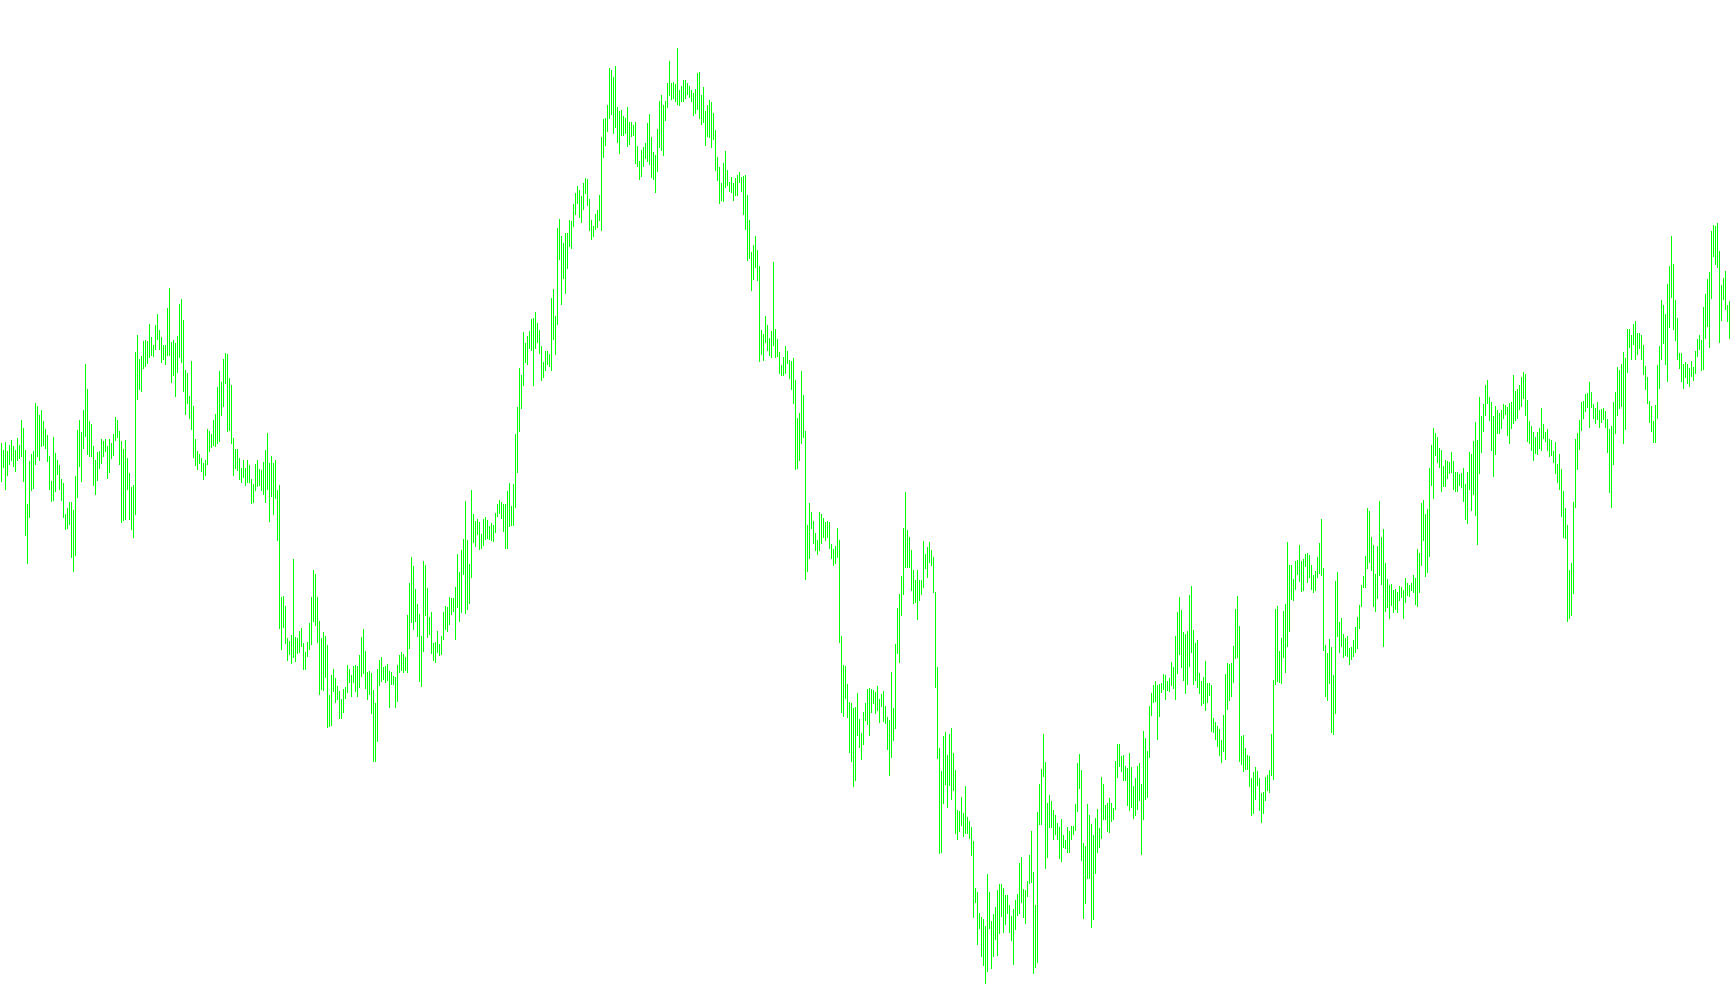
This script is a technical analysis tool designed to provide traders with a smoother representation of price action by using Linear Regression mathematics. Instead of simply connecting dots between price points, it calculates a "best-fit" line to identify the underlying trend of the market over a specific period.
How the Logic Works
1. Trend Smoothing and Analysis The core purpose of this script is to filter out the immediate "noise" of the market (small, erratic price fluctuations) to reveal the broader direction. It looks back at a predetermined number of previous price candles (defined by the "LRPeriod" setting) and performs a mathematical calculation to determine the most accurate straight line that can represent those prices.
2. The Mathematical Calculation The script follows a step-by-step logical flow to determine where to place the line on your chart:
- Data Collection: It gathers the closing prices for the number of bars specified in your settings.
- Slope Calculation: It calculates the "slope," which tells the script how sharply the price is moving up or down. By calculating the relationship between time and price, it determines the velocity of the trend.
- Intercept Identification: It finds the starting point (the intercept) of that trend line based on the gathered data.
- Projection: Finally, it calculates a specific value for each point on the chart. The result is a continuous blue line that follows the price, representing the weighted average direction of the market.
How to Interpret the Results
Because this tool uses linear regression, the resulting blue line acts as a mathematical "pathway."
- When the line moves upward, it confirms a statistically stronger bullish trend over the chosen period.
- When it moves downward, it suggests a bearish trend.
- By following this line rather than the raw price candles, traders can better visualize whether the market is accelerating, decelerating, or maintaining a steady trajectory.
In short, this script takes complex statistical formulas and translates them into a simple visual aid, helping you see the "big picture" of price movement by calculating the most logical path the market has taken over a set timeframe.
//+------------------------------------------------------------------+
//|                                                       linreg.mq4 |
//|                                         Copyright © 2006, ch33z3 |
//|                                   http://4xjournal.blogspot.com/ |
//+------------------------------------------------------------------+
#property  copyright "Copyright © 2006, ch33z3"
#property  link      "http://4xjournal.blogspot.com/"

#property indicator_chart_window
#property indicator_buffers 1
#property indicator_color1 Blue

extern int LRPeriod=13;

double ind_buffer[];

int init()
  {
   IndicatorBuffers(1);
   SetIndexStyle(0,DRAW_LINE,0,1);
   SetIndexBuffer(0,ind_buffer);
   return(0);
  }

int start()
  {
   int limit, i;
   int counted_bars=IndicatorCounted();
   if(counted_bars<0) return(-1);
   if(counted_bars>0) counted_bars--;
   limit=Bars-counted_bars;
   for(i=limit; i>=0; i--) {
      ind_buffer[i]=linreg(LRPeriod,i);
   }
   return(ind_buffer[0]);
  }
//+------------------------------------------------------------------+

double linreg(int p,int i)
   {
   double SumY=0;
   double Sum1=0;
   double Slope=0;
   double c;

   for (int x=0; x<=p-1;x++) {
      c=Close[x+i];
      SumY+=c;
      Sum1+=x*c; }
   double SumBars=p*(p-1)*0.5;
   double SumSqrBars=(p-1)*p*(2*p-1)/6;
	double Sum2=SumBars*SumY;
	double Num1=p*Sum1-Sum2;
	double Num2=SumBars*SumBars-p*SumSqrBars;
	if(Num2!=0) Slope=Num1/Num2;
	else Slope=0;
	double Intercept=(SumY-Slope*SumBars)/p;
	double linregval=Intercept+Slope*(p-1);
	return(linregval);
	}
Comments