JoeChalhoub_BreakingZone
Download script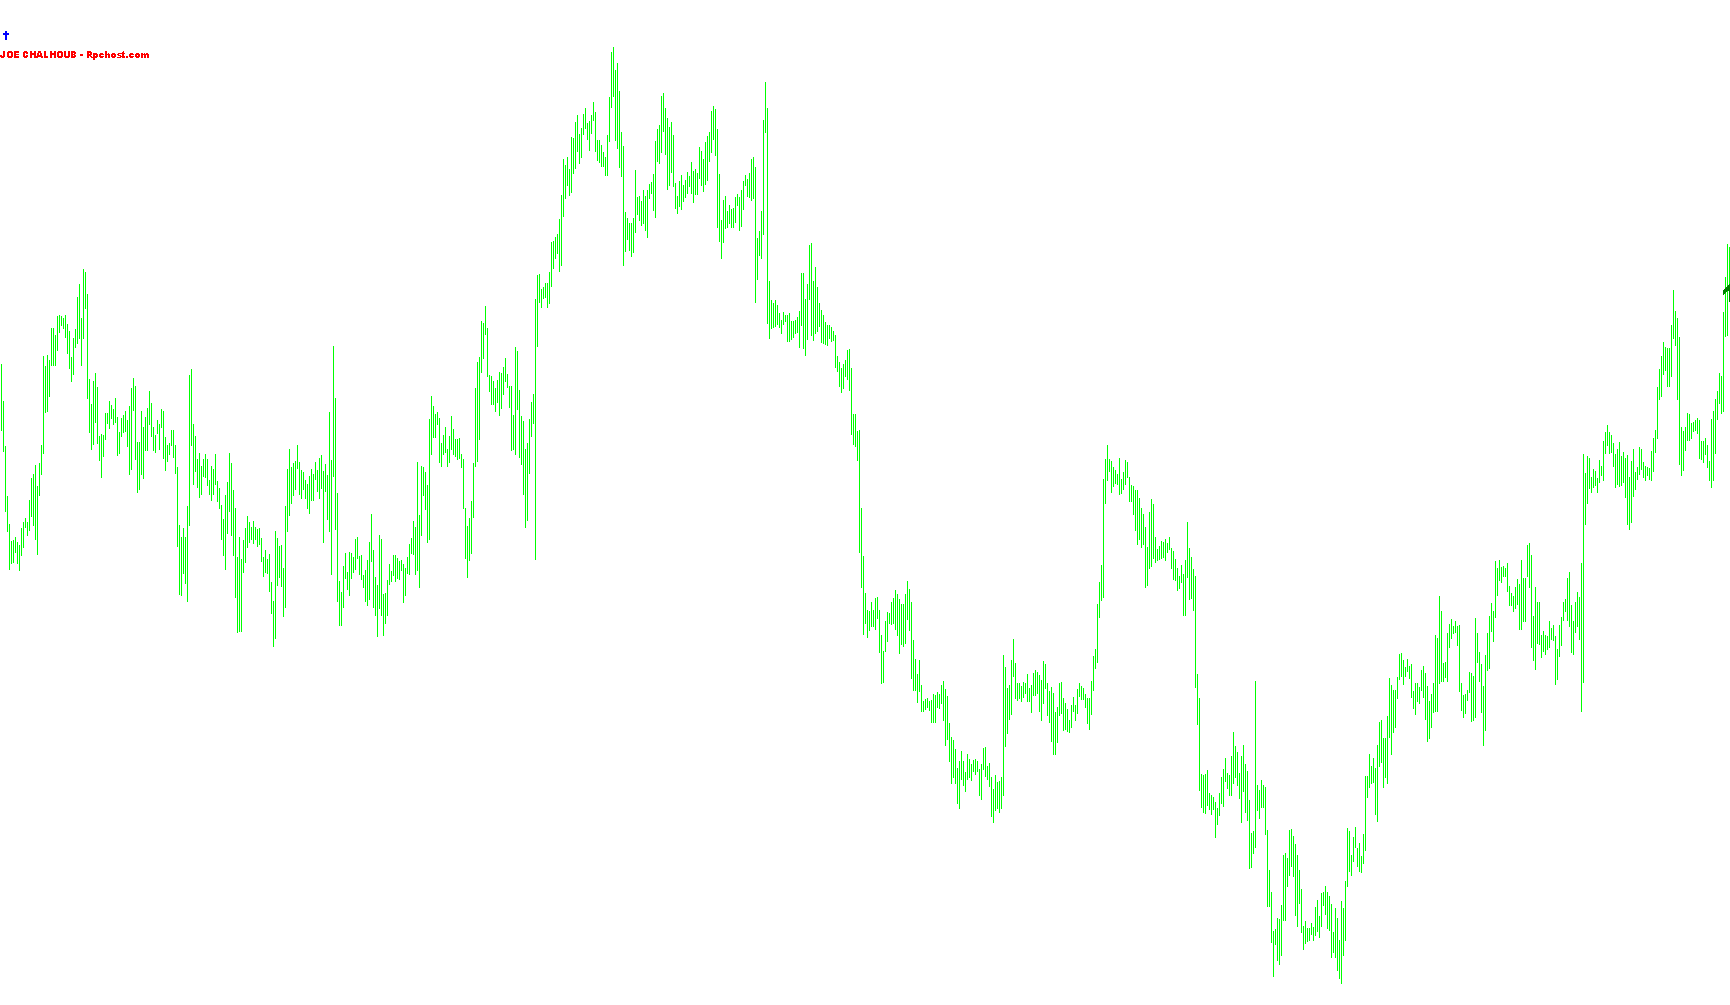
The BreakingZone script is a visual trading tool designed to identify and highlight significant price action zones and trend shifts on a currency or asset chart. It works by monitoring historical price movements to detect "breakouts"—moments where the price moves with enough momentum to establish a new level of interest for traders.
Core Functionality
The script scans past price data to find specific candles that exhibit strong movement. When it detects a significant upward or downward move that exceeds a user-defined volatility threshold (the "Minimum Factor"), it marks that specific price point as a potential Breaking Zone.
- Upward Movements: If the price rises sharply, the script identifies the midpoint of that move and creates a "Support" zone.
- Downward Movements: If the price drops sharply, the script identifies the midpoint of that drop and creates a "Resistance" zone.
Visual Elements & Indicators
The tool provides real-time visual feedback on your chart through several methods:
- Dynamic Zones: It draws lines or zones on the chart representing these identified levels. These act as visual boundaries where price may react, stall, or break through in the future.
- Trend Tracking: The script monitors whether the price is breaking above established support levels or below resistance levels.
- Signal Arrows: When the current live price interacts with these pre-identified zones in a specific way (such as closing above an old high or below an old low), the script draws visual arrows to signal a potential trend change.
- Automated Alerts: Depending on your settings, the script can provide real-time notifications via pop-up windows on your screen or email alerts when these significant price interactions occur.
User Experience and Customization
The logic is designed to be flexible for different trading styles:
- Timeframe Adaptation: It automatically adjusts its labels based on the timeframe you are viewing (Minutes, Hours, Days, etc.).
- Sensitivity Control: Users can adjust the "Minimum Factor" to determine how "aggressive" a price move must be before the script recognizes it as a valid breaking zone.
- Visual Clarity: The script manages the "cleanup" of the chart automatically, removing old or irrelevant data points so that the current trading view remains clear and focused on active price levels.
In summary, this tool serves as a map for traders, identifying historical "battlegrounds" between buyers and sellers and highlighting exactly where the market is currently breaking out into new territory.
//JoeChalhoub_BreakingZone
//webmaster@rpchost.com - www.rpchost.Comment
// -----------------------------------------------------------------------------------------
#property indicator_chart_window
string Target,ask,SL,bid , strSell,strBuy;
double point;
extern string Symbol1 = "";
extern string Symbol2 = "";
extern int CustomPeriod = 0;
extern int MaxBars = 500;
extern double MinFactor = 2;
extern bool Popup = true;
extern bool Mail = false;
extern color ColLineLong ;
extern color ColLineShort ;
extern color ColZoneLong ;
extern color ColZoneShort ;
extern color ColZoneLongOld;
extern color ColZoneShortOld;
int MaxLines = 2000;
double L[2000], S[2000];
double LM[2000], SM[2000];
datetime LT[2000], ST[2000];
int Trend;
double RealPoint;
string PeriodNice;
int init() {
ObjectCreate("Symbol1",OBJ_LABEL,0,0,0,0,0);
ObjectCreate("Symbol2",OBJ_LABEL,0,0,0,0,0);
for(int i = 0; i < MaxLines; i++) {
L[i] = 0;
S[i] = 0;
LM[i] = 0;
SM[i] = 0;
}
Trend = 0;
RealPoint = GetRealPoint();
PeriodNice = GetPeriodNice(CustomPeriod);
return(0);
}
int deinit() {
for(int j = 0; j < MaxLines; j++) {
ObjectDelete("ZS"+j+PeriodNice);
ObjectDelete("ZSA"+j+PeriodNice);
ObjectDelete("ZSB"+j+PeriodNice);
ObjectDelete("ZL"+j+PeriodNice);
ObjectDelete("ZLA"+j+PeriodNice);
ObjectDelete("ZLB"+j+PeriodNice);
}
for(j = 0; j < Trend; j++) ObjectDelete("ZR"+j+PeriodNice);
ObjectDelete("Symbol1");
ObjectDelete("Symbol2");
return(0);
}
double GetRealPoint() {
switch (Digits) {
case 3: return(0.01);
case 5: return(0.0001);
}
return(Point);
}
string GetPeriodNice(int s) {
if (s == 0) s = Period();
if (s % 60 > 0) return("M"+s);
s /= 60;
if (s % 24 > 0) return("H"+s);
s /= 24;
if (s % 7 == 0) return("W"+s/7);
if (s % 30 == 0) return("MN"+s/30);
return("D"+s);
}
double Ti(int s) {
return(iTime(NULL, CustomPeriod, s));
}
double Op(int s) {
return(iOpen(NULL, CustomPeriod, s));
}
double Cl(int s) {
return(iClose(NULL, CustomPeriod, s));
}
string GetTimeDiffNice(int t) {
t = Time[0] - t;
if (t < 120) return(t+" seconds ago");
t /= 60;
if (t < 120) return(t+" minutes ago");
t /= 60;
if (t < 48) return(t+" hours ago");
t /= 24;
return(t+" days ago");
}
void DisplayAlert(string s) {
if (Popup) Alert(s);
Comment(TimeToStr(TimeCurrent(), TIME_MINUTES)+" "+s);
if (Mail) SendMail(s, s);
}
void DrawPriceTrendLine(datetime x1, datetime x2, double y1,
double y2, color lineColor, double style)
{
string label = "DivergenceLine2.1# " + DoubleToStr(x1, 0);
ObjectCreate(label, OBJ_ARROW, 0, x2, y1, x1, y2, 0, 0);
ObjectSet(label,OBJPROP_COLOR,lineColor);
ObjectSet(label,OBJPROP_SCALE,500);
ObjectSet(label,OBJPROP_RAY, true);
ObjectSet(label,OBJPROP_WIDTH,2);
if(lineColor == Red)
ObjectSet(label,OBJPROP_ARROWCODE,234);
if(lineColor == Green)
ObjectSet(label,OBJPROP_ARROWCODE,233);
}
int start() {
string Symbol_1 = " ";
string Symbol_2 = "JOE CHALHOUB - Rpchost.com";
ObjectSetText("Symbol1",Symbol_1,"7","Arial Black",Lime);
ObjectSet("Symbol1",OBJPROP_XDISTANCE,3);
ObjectSet("Symbol1",OBJPROP_YDISTANCE,30);
ObjectSet("Symbol1",OBJPROP_COLOR,Blue);
ObjectSet("Symbol1",OBJPROP_CORNER,"111");
ObjectSetText("Symbol2",Symbol_2,"7","Arial Black",Lime);
ObjectSet("Symbol2",OBJPROP_XDISTANCE,3);
ObjectSet("Symbol2",OBJPROP_YDISTANCE,50);
ObjectSet("Symbol2",OBJPROP_COLOR,Red);
ObjectSet("Symbol2",OBJPROP_CORNER,"111");
static double old = 0;
static double level = 0;
if (old > 0) for(int j = 0; j < MaxLines; j++) {
if ((S[j] > 0) && (level != S[j]) && (Close[0] == High[0]) && (Close[0] > S[j]) && (old <= S[j])) {
//LONG
DrawPriceTrendLine(Time[0], Time[0], Low[0],High[0], Green, STYLE_SOLID);
//END LONG
level = S[j];
break;
}
if ((L[j] > 0) && (level != L[j]) && (Close[0] == Low[0]) && (Close[0] < L[j]) && (old >= L[j])) {
//SHORT
DrawPriceTrendLine(Time[0], Time[0], High[0], High[0], Red, STYLE_DASHDOTDOT);
//END SHORT
level = L[j];
break;
}
}
old = Close[0];
static datetime latest = 0;
int changed = Bars - IndicatorCounted();
if (changed < 2) return(0);
for(int i = MathMin(changed-1, MaxBars); i > 0; i--) {
if (latest >= Ti(i)) continue;
latest = Ti(i);
for(j = 0; j < MaxLines; j++) {
if ((L[j] > 0) && (Cl(i) < LM[j])) {
string n = "ZR"+Trend+PeriodNice;
L[j] = 0;
Trend++;
}
if ((S[j] > 0) && (Cl(i) > SM[j])) {
n = "ZR"+Trend+PeriodNice;
S[j] = 0;
Trend++;
}
}
double r = MathAbs(Cl(i+1) - Cl(i+2)) * MinFactor;
double h = (Cl(i+1) + Cl(i)) / 2;
if (Cl(i) - Cl(i+1) > r) {
for(j = 0; j < MaxLines; j++) {
if (L[j] == h) break;
if (L[j] != 0) continue;
L[j] = h;
LM[j] = MathMax(Op(i+1), Cl(i+1));
LT[j] = Ti(i);
break;
}
}
if (Cl(i) - Cl(i+1) < -r) {
for(j = 0; j < MaxLines; j++) {
if (S[j] == h) break;
if (S[j] != 0) continue;
S[j] = h;
SM[j] = MathMin(Op(i+1), Cl(i+1));
ST[j] = Ti(i);
break;
}
}
}
for(j = 0; j < MaxLines; j++) {
n = "ZL"+j+PeriodNice;
string na = "ZLA"+j+PeriodNice;
string nb = "ZLB"+j+PeriodNice;
if (L[j] == 0) {
ObjectDelete(n);
ObjectDelete(na);
ObjectDelete(nb);
continue;
}
}
for(j = 0; j < MaxLines; j++) {
n = "ZS"+j+PeriodNice;
na = "ZSA"+j+PeriodNice;
nb = "ZSB"+j+PeriodNice;
if (S[j] == 0) {
ObjectDelete(n);
ObjectDelete(na);
ObjectDelete(nb);
continue;
}
}
return(0);
}
Comments