JMASlope_MTF
Download script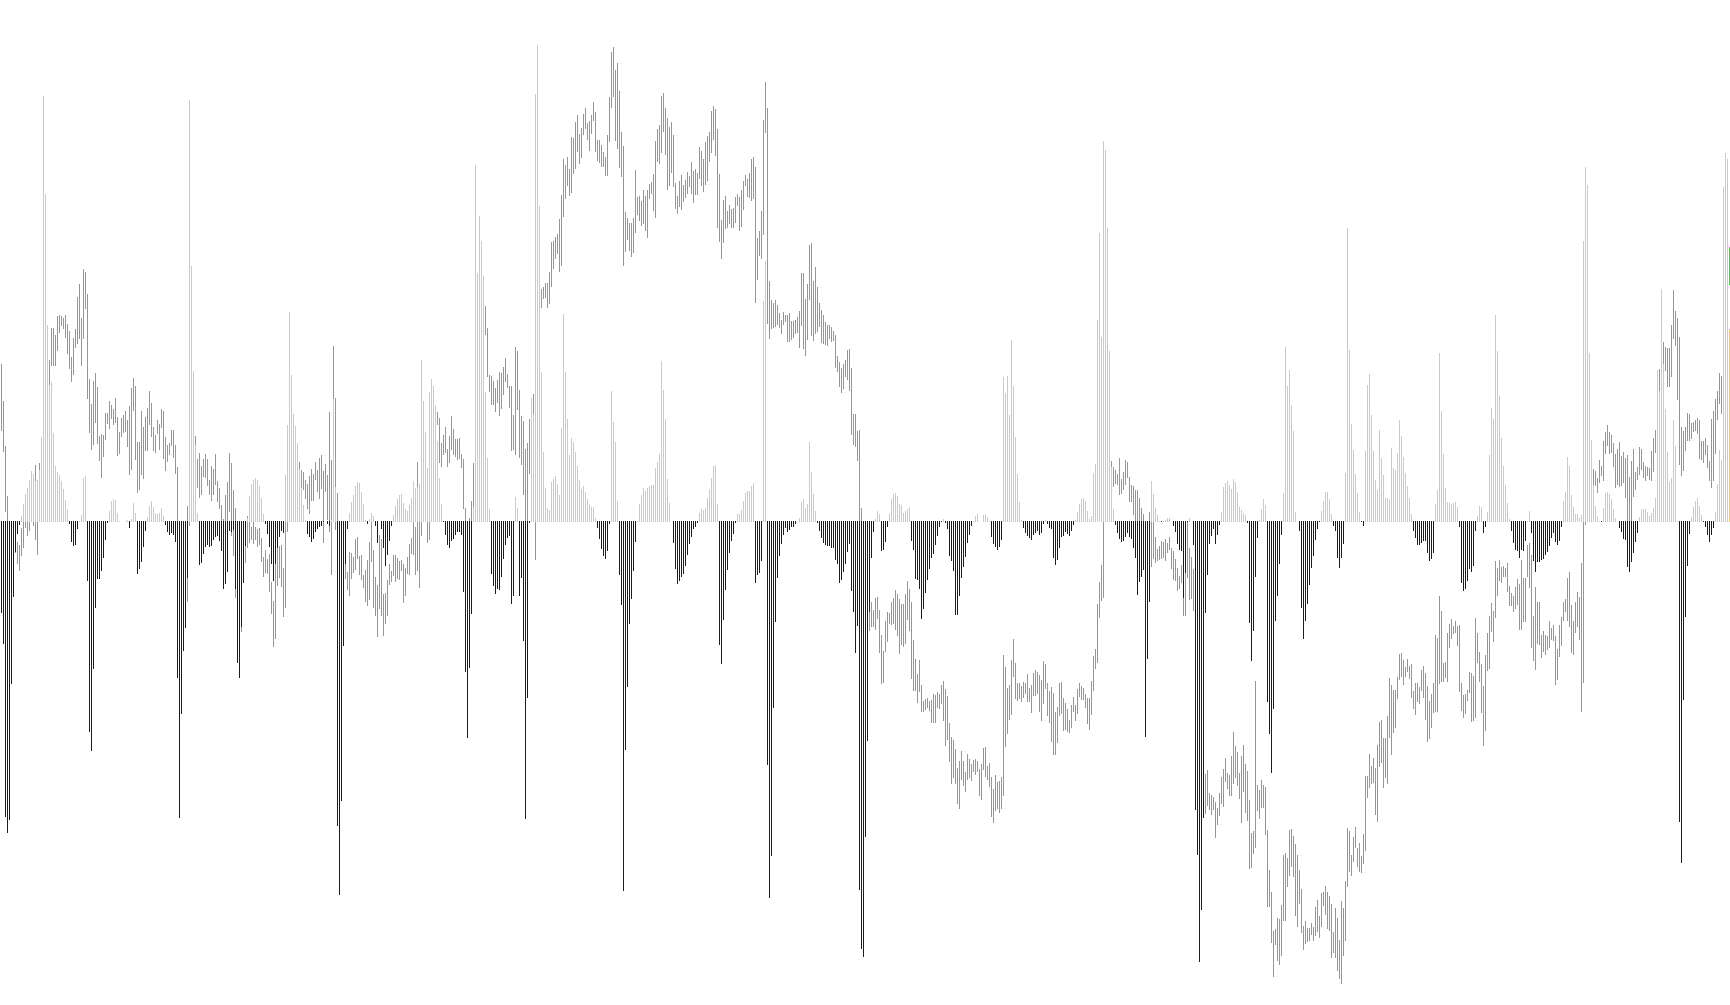
The JMASlope Multi-Timeframe indicator is designed to help traders visualize market momentum and trend direction by analyzing price movements across different time horizons simultaneously. Rather than simply showing you what is happening on your current chart, this tool allows you to "look ahead" or "look up" into higher timeframes to gain a broader perspective on the market's trajectory.
Core Functionality
The primary purpose of this script is Multi-Timeframe (MTF) analysis. It acts as a bridge, pulling data from larger trading periods (such as hourly, daily, or weekly charts) and displaying that information directly on your active trading screen. This helps traders ensure that their short-term trades are aligned with the "big picture" trend, which is a fundamental principle of successful technical analysis.
Key Logic Components:
-
Timeframe Synchronization: The script includes a built-in validation system. It ensures that the higher timeframe you choose to analyze is compatible with your current chart. If you attempt to view a timeframe that is smaller than your current one, the system will notify you, as viewing lower-than-current data on a high chart can lead to visual clutter and inaccurate signals.
-
Dynamic Data Retrieval: The logic works by automatically calculating the correct "shift" in time. It identifies where a specific moment on your current chart aligns with a candle on the higher timeframe. By doing this, it ensures that the data you see is perfectly synced; for example, if you are looking at a 15-minute chart but want to see the trend of a 4-hour candle, the script aligns the two seamlessly.
-
Dual Momentum Tracking: The indicator tracks two distinct components of price movement:
- Upward Momentum: Represented by a green histogram, showing the strength of positive price growth.
- Downward Momentum: Represented by a red histogram, highlighting the intensity of price declines.
-
Visual Representation: Instead of complex lines that can sometimes be difficult to interpret quickly, this script uses a Histogram format. This makes it much easier for a trader to see at a glance whether the market is currently accelerating, decelerating, or changing direction based on the height and color of the bars.
How it Helps the Trader
By using this logic, you can avoid "trading against the tide." For instance, even if your current small timeframe shows a minor price increase, this indicator might show you that the larger daily trend is still strongly downward. It provides a layer of confirmation, helping you filter out market noise and focus on the most reliable trends.
//+------------------------------------------------------------------+
//|                                                 JMASlope_MTF.mq4 |
//|                      Copyright © 2007, ASystem 2000             |
//|                                        asystem2000@rambler.ru    |
//+------------------------------------------------------------------+
#property copyright "Copyright © 2007, Asystem2000"
#property link      "asystem2000@rambler.ru"

#property indicator_separate_window
#property indicator_buffers 2
#property indicator_color1 LimeGreen
#property indicator_color2 Red
//---- input parameters
extern int       TimeFrame=0;
extern int       Length=14;
extern int       Phase=0;
extern string    Note="Yoy can adjust indicator name";
extern string    Indicator="JMASlope";

//---- buffers
double B_Up[];
double B_Dn[];
//+------------------------------------------------------------------+
//| Custom indicator initialization function                         |
//+------------------------------------------------------------------+
int init()
  {
  if (TimeFrame!=0)
  {
  if (TimeFrame<Period())
     {
       Alert("Íàñòðàèâàåìûé òàéìôðåéì äîëæåí áûòü áîëüøå òåêóùåãî èëè ðàâåí 0");
       deinit();
       return(0);
     }
  }

 bool OK_Period=false;
  switch (TimeFrame)
  {
    case 0:OK_Period=true;break;
    case 1:OK_Period=true;break;
    case 5:OK_Period=true;break;
    case 15:OK_Period=true;break;
    case 30:OK_Period=true;break;
    case 60:OK_Period=true;break;
    case 240:OK_Period=true;break;
    case 1440:OK_Period=true;break;
    case 10080:OK_Period=true;break;
    case 43200:OK_Period=true;break;
  }
  if (OK_Period==false)
     {
       Alert("Âû ââåëè íåêîððåêòíóþ öèôðó òàéìôðåéìà");
       deinit();
       return(0);
     }


//---- indicators
   SetIndexStyle(0,DRAW_HISTOGRAM,0,0);
   SetIndexBuffer(0,B_Up);
   SetIndexStyle(1,DRAW_HISTOGRAM,0,0);
   SetIndexBuffer(1,B_Dn);
//----
   return(0);
  }
//+------------------------------------------------------------------+
//| Custom indicator deinitialization function                       |
//+------------------------------------------------------------------+
int deinit()
  {
//----

//----
   return(0);
  }
//+------------------------------------------------------------------+
//| Custom indicator iteration function                              |
//+------------------------------------------------------------------+
int start()
  {
   int    counted_bars=IndicatorCounted();
   int limit;
   if (TimeFrame>0) limit=Bars-counted_bars+(2*TimeFrame/Period());
   else limit=Bars-counted_bars-1;
   int    C_time;
   int    Bar_Shift;
   if (limit==0) return(0);
//----
   int i=0;
   while(i<=limit)
   {
     C_time=Time[i];
     Bar_Shift=iBarShift(NULL,TimeFrame,C_time,false);
     B_Up[i]=iCustom(NULL,TimeFrame,Indicator,Length,Phase,0,Bar_Shift);
     B_Dn[i]=iCustom(NULL,TimeFrame,Indicator,Length,Phase,1,Bar_Shift);
     i++;
   }


//----
   return(0);
  }
//+------------------------------------------------------------------+
Comments