EMA CROSSOVER SIGNAL_v1
Download script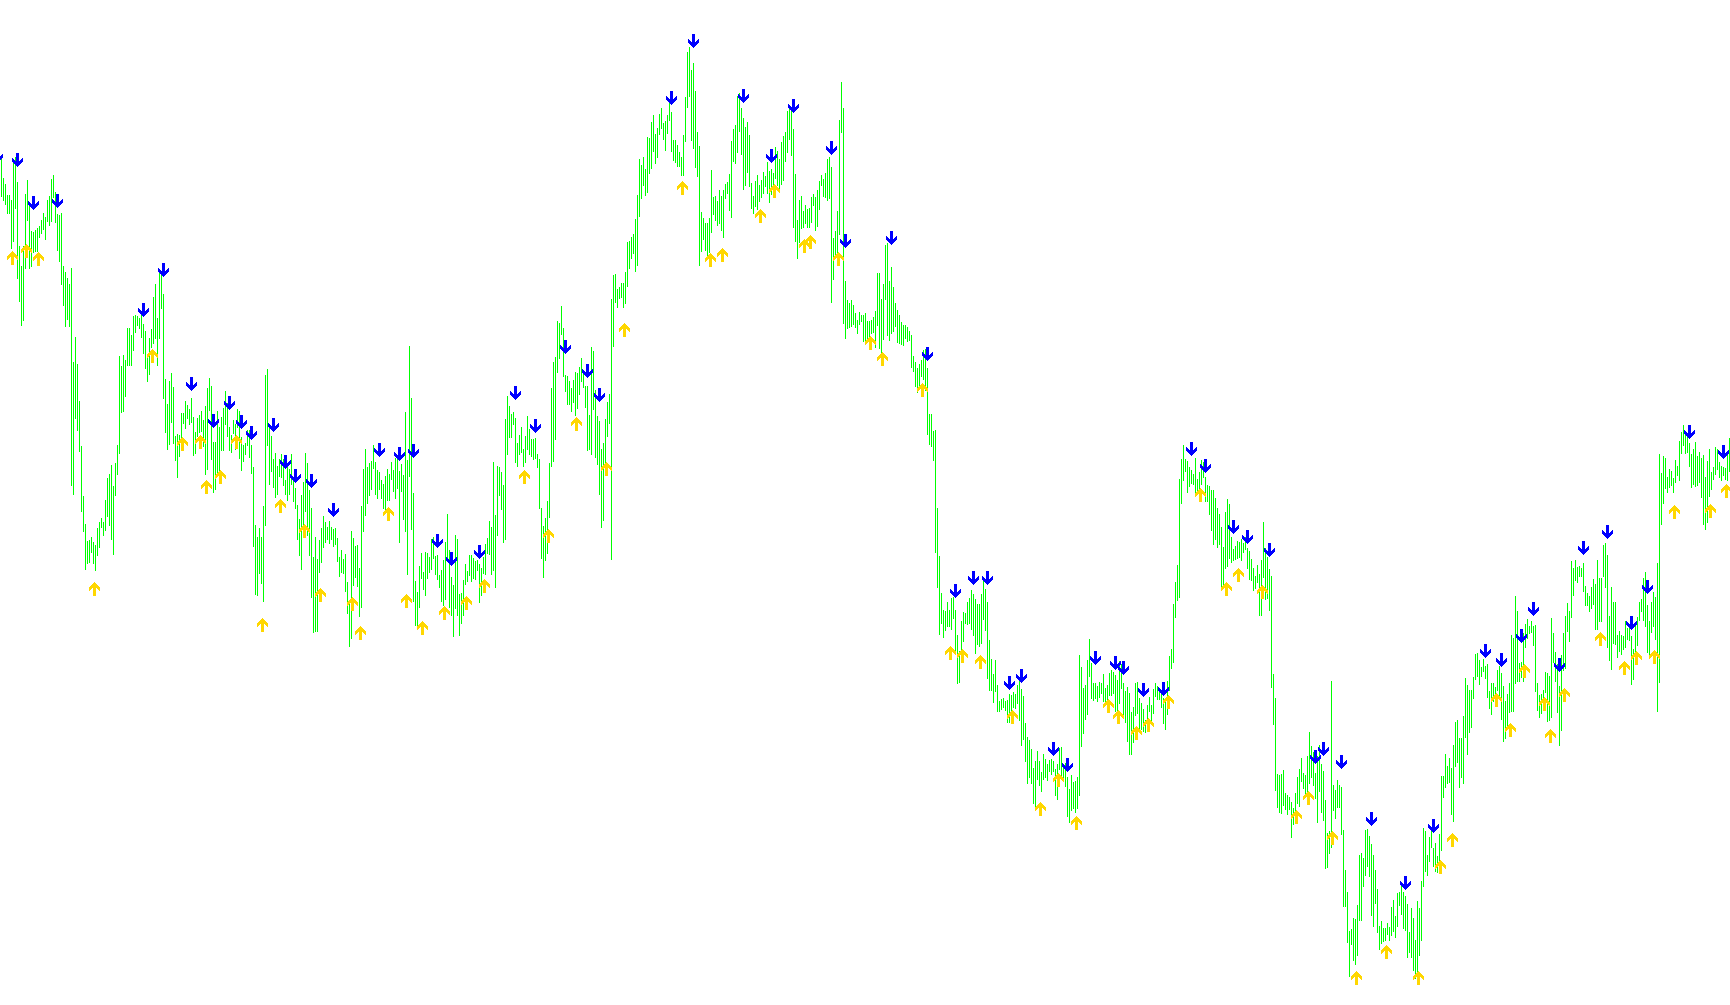
This tool is designed to simplify the way traders identify trend reversals by pinpointing the exact moment two moving averages intersect on a chart. Instead of forcing you to squint at overlapping lines or constantly watch fast-moving candles, this script acts as an automated visual assistant that marks "crossover" events with clear icons.
How it Works
The logic relies on comparing two different Exponential Moving Averages (EMAs)—one "fast" and one "slow." These averages represent the momentum of the price over specific timeframes. The script continuously monitors the relationship between these two lines:
- Bullish Signals: When the faster average moves from below the slower average to above it, the script identifies a potential upward momentum shift. It places a visual marker (an arrow) just below the candle at that specific point in time.
- Bearish Signals: Conversely, when the faster average drops from above the slower average to below it, the script identifies a potential downward momentum shift. It places a visual marker just above the candle.
Smart Visual Positioning
To ensure the information is easy to read, the script doesn't just place markers randomly. It calculates the "Average Range" of recent price activity (the typical height of the candles in that area). It then uses this calculation to offset the arrows perfectly, ensuring they appear clearly above or below the price action without cluttering the actual candles.
Key Benefits for Traders
- Clarity: It eliminates the need to manually track when lines cross, which can be difficult to see on small screens or highly volatile charts.
- Customization: You can adjust the time periods for both the "Faster" and "Slower" averages to suit your specific trading strategy (e.g., scalping vs. swing trading).
- Clean Charts: Because the script provides these visual signals, you have the option to remove the actual moving average lines from your chart entirely, allowing for a much cleaner and less distracting workspace while still receiving all the necessary crossover alerts.
/*-----------------------------+
|			       |
| Shared by www.Aptrafx.com    |
|			       |
+------------------------------*/

//+------------------------------------------------------------------+
//|                                         EMA-Crossover_Signal.mq4 |
//|         Copyright © 2005, Jason Robinson (jnrtrading)            |
//|                   http://www.jnrtading.co.uk                     |
//+------------------------------------------------------------------+

/*
  +------------------------------------------------------------------+
  | Allows you to enter two ema periods and it will then show you at |
  | Which point they crossed over. It is more usful on the shorter   |
  | periods that get obscured by the bars / candlesticks and when    |
  | the zoom level is out. Also allows you then to remove the emas   |
  | from the chart. (emas are initially set at 5 and 6)              |
  +------------------------------------------------------------------+
*/
#property copyright "Copyright © 2005, Jason Robinson (jnrtrading)"
#property link      "http://www.jnrtrading.co.uk"

#property indicator_chart_window
#property indicator_buffers 2
#property indicator_color1 SpringGreen
#property indicator_color2 Red

double CrossUp[];
double CrossDown[];
extern int FasterEMA = 5;
extern int SlowerEMA = 6;
//+------------------------------------------------------------------+
//| Custom indicator initialization function                         |
//+------------------------------------------------------------------+
int init()
  {
//---- indicators
   SetIndexStyle(0, DRAW_ARROW, EMPTY);
   SetIndexArrow(0, 233);
   SetIndexBuffer(0, CrossUp);
   SetIndexStyle(1, DRAW_ARROW, EMPTY);
   SetIndexArrow(1, 234);
   SetIndexBuffer(1, CrossDown);
//----
   return(0);
  }
//+------------------------------------------------------------------+
//| Custom indicator deinitialization function                       |
//+------------------------------------------------------------------+
int deinit()
  {
//----

//----
   return(0);
  }
//+------------------------------------------------------------------+
//| Custom indicator iteration function                              |
//+------------------------------------------------------------------+
int start() {
   int limit, i, counter;
   double fasterEMAnow, slowerEMAnow, fasterEMAprevious, slowerEMAprevious, fasterEMAafter, slowerEMAafter;
   double Range, AvgRange;
   int counted_bars=IndicatorCounted();
//---- check for possible errors
   if(counted_bars<0) return(-1);
//---- last counted bar will be recounted
   if(counted_bars>0) counted_bars--;

   limit=Bars-counted_bars;

   for(i = 0; i <= limit; i++) {

      counter=i;
      Range=0;
      AvgRange=0;
      for (counter=i ;counter<=i+9;counter++) {
         AvgRange=AvgRange+MathAbs(High[counter]-Low[counter]);
      }
      Range=AvgRange/10;

      fasterEMAnow = iMA(NULL, 0, FasterEMA, 0, MODE_LWMA, PRICE_CLOSE, i);
      fasterEMAprevious = iMA(NULL, 0, FasterEMA, 0, MODE_LWMA, PRICE_CLOSE, i+1);
      fasterEMAafter = iMA(NULL, 0, FasterEMA, 0, MODE_LWMA, PRICE_CLOSE, i-1);

      slowerEMAnow = iMA(NULL, 0, SlowerEMA, 0, MODE_LWMA, PRICE_CLOSE, i);
      slowerEMAprevious = iMA(NULL, 0, SlowerEMA, 0, MODE_LWMA, PRICE_CLOSE, i+1);
      slowerEMAafter = iMA(NULL, 0, SlowerEMA, 0, MODE_LWMA, PRICE_CLOSE, i-1);

      if ((fasterEMAnow > slowerEMAnow) && (fasterEMAprevious < slowerEMAprevious) && (fasterEMAafter > slowerEMAafter)) {
         CrossUp[i] = Low[i] - Range*0.5;
      }
      else if ((fasterEMAnow < slowerEMAnow) && (fasterEMAprevious > slowerEMAprevious) && (fasterEMAafter < slowerEMAafter)) {
         CrossDown[i] = High[i] + Range*0.5;
      }
   }
   return(0);
}
Comments