EMA-Crossover_Signal_v1
Download script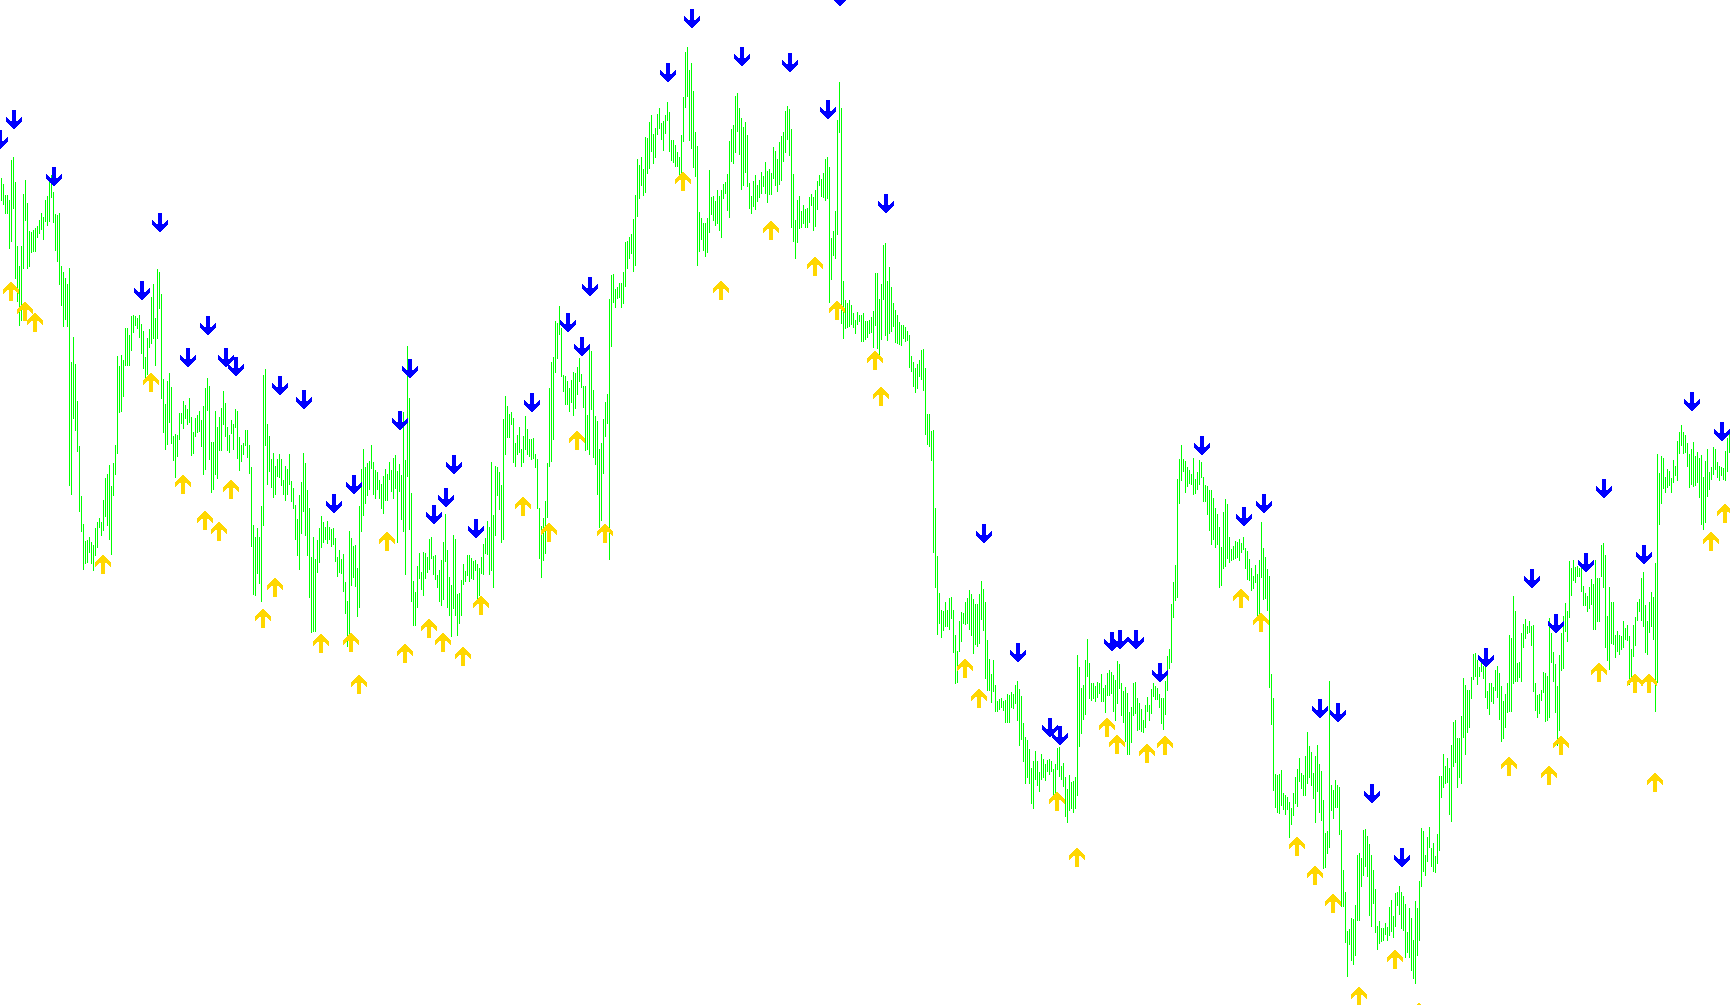
This tool is designed for traders who use Exponential Moving Averages (EMAs) to identify trends in the financial markets. While many traders keep moving averages on their charts constantly, these lines can sometimes become cluttered or difficult to see clearly when looking at very short timeframes or zoomed-out views. This script solves that problem by acting as a visual "alert system" that highlights exactly where two different EMAs cross each other.
How it Works
The logic behind the script is based on the relationship between two moving averages: a "Faster" EMA and a "Slower" EMA. In trading, when a faster moving average crosses over a slower one, it often signals a change in momentum or a potential shift in the market direction.
Instead of requiring you to watch the lines constantly, the script performs the following actions automatically:
- Continuous Monitoring: The tool constantly calculates the position of both moving averages based on the price data provided (using user-defined periods, such as 5 and 6 by default).
- Crossover Detection: It looks for a specific "cross" event. It checks if the faster line was below the slower line in the previous candle and moved above it in the current candle (a "Cross Up"), or vice versa (a "Cross Down").
- Smart Visual Signaling: When a crossover is confirmed, the script places a visual symbol (an arrow) directly on your chart.
- It places a signal below the price when an upward trend is detected.
- It places a signal above the price when a downward trend is detected.
- Dynamic Positioning: To ensure the signals are always easy to see, the script calculates the "range" (the volatility) of the recent price action. It then offsets the arrows slightly away from the candles based on this range, ensuring that the signals don't overlap with the price bars.
Key Benefits for Users
- Clutter Reduction: You can remove the actual moving average lines from your chart entirely to keep your workspace clean, while still benefiting from the visual cues provided by the script.
- Precision: It identifies exact crossover points that might be hard to see manually when the chart is moving quickly or zoomed out.
- Customization: You can adjust the periods for the "Faster" and "Slower" averages to match your specific trading strategy, allowing the tool to adapt to different market conditions.
/*-----------------------------+
|			       |
| Shared by www.Aptrafx.com    |
|			       |
+------------------------------*/

//+------------------------------------------------------------------+
//|                                         EMA-Crossover_Signal.mq4 |
//|         Copyright © 2005, Jason Robinson (jnrtrading)            |
//|                   http://www.jnrtading.co.uk                     |
//+------------------------------------------------------------------+

/*
  +------------------------------------------------------------------+
  | Allows you to enter two ema periods and it will then show you at |
  | Which point they crossed over. It is more usful on the shorter   |
  | periods that get obscured by the bars / candlesticks and when    |
  | the zoom level is out. Also allows you then to remove the emas   |
  | from the chart. (emas are initially set at 5 and 6)              |
  +------------------------------------------------------------------+
*/
#property copyright "Copyright © 2005, Jason Robinson (jnrtrading)"
#property link      "http://www.jnrtrading.co.uk"

#property indicator_chart_window
#property indicator_buffers 2
#property indicator_color1 Green
#property indicator_color2 Red

double CrossUp[];
double CrossDown[];
double TestLine[];
extern int FasterEMA = 5;
extern int SlowerEMA = 6;
//+------------------------------------------------------------------+
//| Custom indicator initialization function                         |
//+------------------------------------------------------------------+
int init()
  {
//---- indicators
   IndicatorBuffers(3);
   SetIndexStyle(0, DRAW_ARROW, 0, 2); //EMPTY);
   SetIndexArrow(0, 233);
   SetIndexBuffer(0, CrossUp);
   SetIndexStyle(1, DRAW_ARROW, 0, 2); //EMPTY);
   SetIndexArrow(1, 234);
   SetIndexBuffer(1, CrossDown);
   SetIndexBuffer(2, TestLine);
//----
   return(0);
  }
//+------------------------------------------------------------------+
//| Custom indicator deinitialization function                       |
//+------------------------------------------------------------------+
int deinit()
  {
//----

//----
   return(0);
  }
//+------------------------------------------------------------------+
//| Custom indicator iteration function                              |
//+------------------------------------------------------------------+
int start() {
   int limit, i, counter;
   double fasterEMAnow, slowerEMAnow, fasterEMAprevious, slowerEMAprevious, fasterEMAafter, slowerEMAafter;
   double Range, AvgRange;
   int counted_bars=IndicatorCounted();
//---- check for possible errors
   if(counted_bars<0) return(-1);
//---- last counted bar will be recounted
   if(counted_bars>0) counted_bars--;

   limit=Bars-counted_bars;

   for(i = 0; i <= limit; i++) {

      counter=i;
      Range=0;
      AvgRange=0;
      for (counter=i ;counter<=i+9;counter++)
      {
         AvgRange=AvgRange+MathAbs(High[counter]-Low[counter]);
      }
      Range=AvgRange/10;

      fasterEMAnow = iMA(NULL, 0, FasterEMA, 0, MODE_EMA, PRICE_CLOSE, i);
      fasterEMAprevious = iMA(NULL, 0, FasterEMA, 0, MODE_EMA, PRICE_CLOSE, i+1);
      fasterEMAafter = iMA(NULL, 0, FasterEMA, 0, MODE_EMA, PRICE_CLOSE, i-1);

      slowerEMAnow = iMA(NULL, 0, SlowerEMA, 0, MODE_EMA, PRICE_CLOSE, i);
      slowerEMAprevious = iMA(NULL, 0, SlowerEMA, 0, MODE_EMA, PRICE_CLOSE, i+1);
      slowerEMAafter = iMA(NULL, 0, SlowerEMA, 0, MODE_EMA, PRICE_CLOSE, i-1);

      if ((fasterEMAnow > slowerEMAnow) && (fasterEMAprevious < slowerEMAprevious) && (fasterEMAafter > slowerEMAafter)) {
         CrossUp[i] = Low[i] - Range*1.5;
      }
      else if ((fasterEMAnow < slowerEMAnow) && (fasterEMAprevious > slowerEMAprevious) && (fasterEMAafter < slowerEMAafter)) {
         CrossDown[i] = High[i] + Range*1.5;
      }
   }
   return(0);
}
Comments