EM12-21
Download script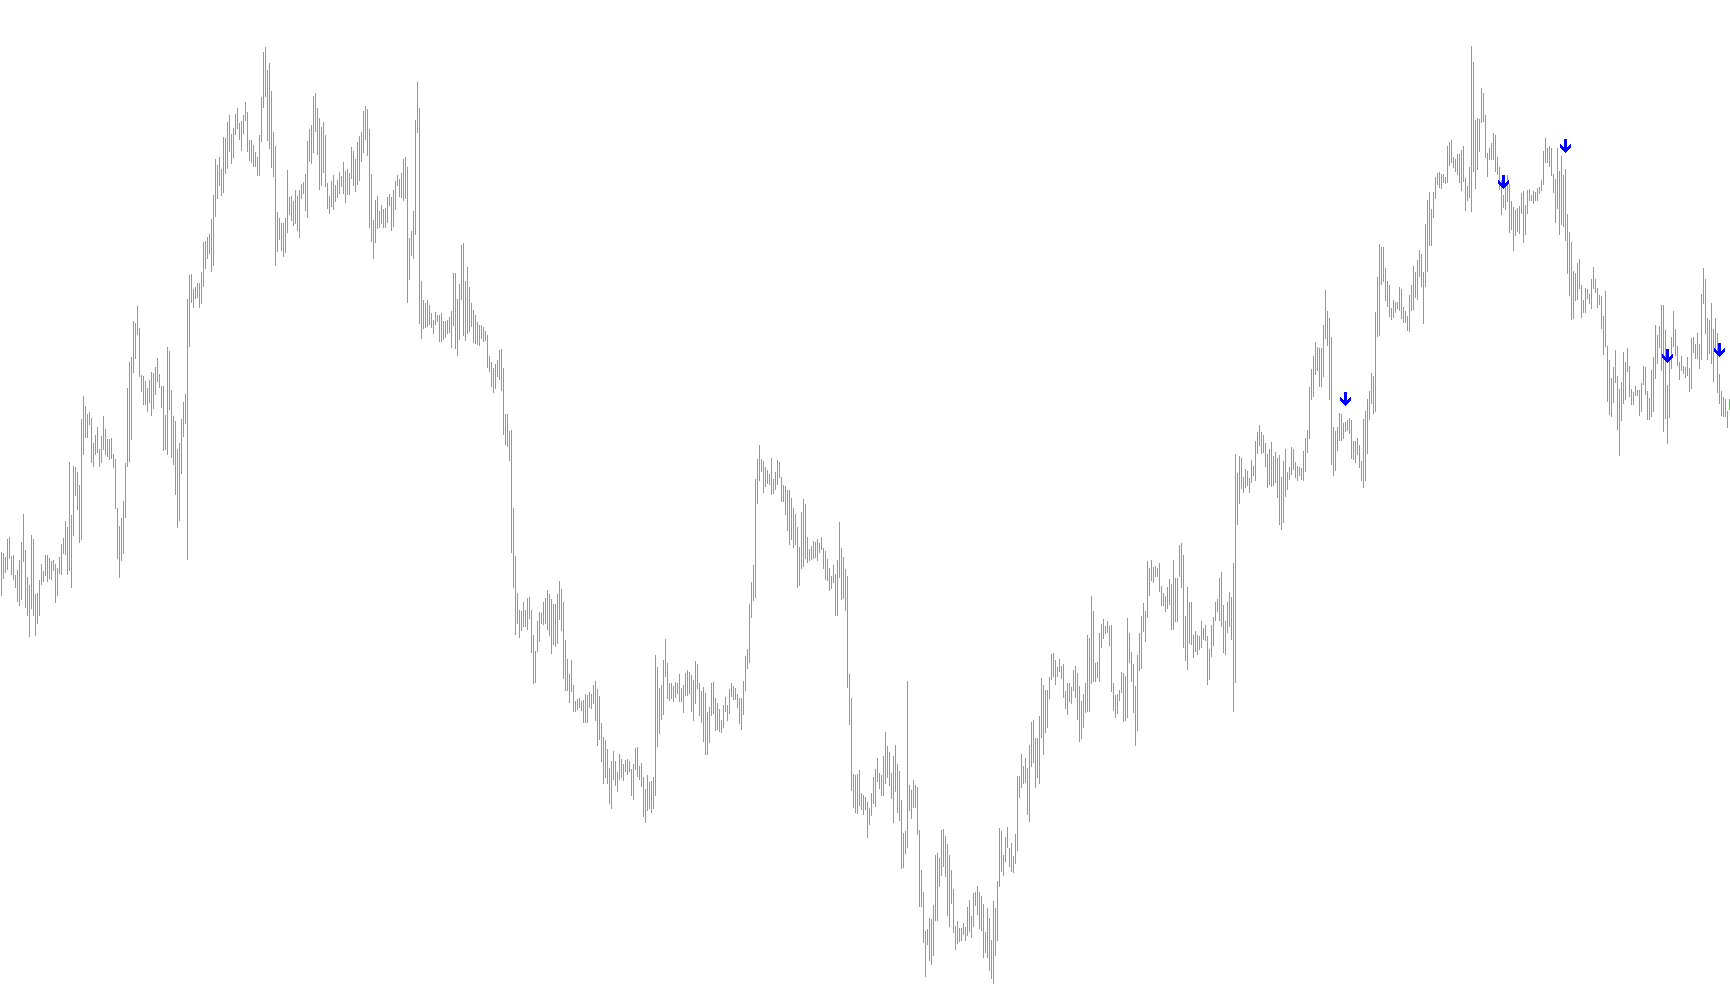
The EM5-Cross script is a technical analysis tool designed to identify specific momentum shifts in the financial markets by tracking the interaction between two moving averages. It serves as a visual signaling system, highlighting points where price trends may be changing direction.
Core Methodology
The logic operates by comparing two different types of Exponential Moving Averages (EMAs): a "Faster" average and a "Slower" average. Because exponential moving averages prioritize recent price data, they react more quickly to market fluctuations than traditional averages. By monitoring these two lines simultaneously, the script detects "crosses," which are often interpreted by traders as signals for potential buying or selling opportunities.
How the Logic Works
To ensure high accuracy and filter out minor market noise, the script follows a rigorous three-step verification process for every price movement:
- Current State Detection: The script first checks if the Faster EMA is currently positioned above or below the Slower EMA.
- Historical Context: It then looks backward at the previous bars to ensure that the two averages were in the opposite position moments before.
- Future Confirmation: Crucially, it also looks slightly ahead (at the most recent data points) to confirm that the crossover is sustained and not just a momentary touch.
A signal is only confirmed if all three conditions are met: the averages must have moved from one side of each other to the other and stayed there.
Visual Signals
Once the logic confirms a crossover, the script places visual markers directly on your chart:
- Buy Signals (Cross Up): When the Faster EMA crosses above the Slower EMA, the script identifies an upward momentum shift. It places a marker below the candle at a distance calculated based on the recent volatility of the market.
- Sell Signals (Cross Down): When the Faster EMA crosses below the Slower EMA, it identifies downward momentum. It places a marker above the candle at a similar distance from the price.
Dynamic Volatility Adjustment
Rather than placing markers at a fixed distance, the script calculates the "Range" of the market by analyzing the high and low prices of the most recent candles. This ensures that the visual signals are scaled appropriately to the current market environment—appearing closer during quiet markets and further away during periods of high volatility, keeping the chart clean and readable.
//+------------------------------------------------------------------+
//|                                         EM5-Cross.mq4            |
//|         Copyright © 2005, Harmeet Singh                          |
//|                   grabapip@yahoo.com                             |
//+------------------------------------------------------------------+


#property copyright "Harmeet Singh"
#property link      "grabapip@yahoo.com"

#property indicator_chart_window
#property indicator_buffers 3
#property indicator_color1 Blue
#property indicator_color2 Orange
#property indicator_color3 Red

extern int MA_Period=13;
extern int MA_Shift=0;
extern int MA_Method=0;
extern int AllBars=250;

double ExtMapBuffer[];
double CrossUp[];
double CrossDown[];
extern int FasterEMA = 12;
extern int SlowerEMA = 21;
//+------------------------------------------------------------------+
//| Custom indicator initialization function                         |
//+------------------------------------------------------------------+
int init()
  {
  int    draw_begin;
   string short_name;
//---- drawing settings
   SetIndexStyle(0,DRAW_LINE);
   SetIndexShift(0,MA_Shift);
   IndicatorDigits(MarketInfo(Symbol(),MODE_DIGITS));
   if(MA_Period<2) MA_Period=13;
   draw_begin=MA_Period-1;

//---- indicators
   SetIndexStyle(0, DRAW_ARROW, EMPTY);
   SetIndexArrow(0, 233);
   SetIndexBuffer(0, CrossUp);
   SetIndexStyle(1, DRAW_ARROW, EMPTY);
   SetIndexArrow(1, 234);
   SetIndexBuffer(1, CrossDown);
   //---- indicator short name
   switch(MA_Method)
     {
      case 1 : short_name="EMA(";  draw_begin=0; break;
      case 2 : short_name="SMMA("; break;
      case 3 : short_name="LWMA("; break;
      default :
         MA_Method=0;
         short_name="SMA(";
     }
   IndicatorShortName(short_name+MA_Period+")");
   SetIndexDrawBegin(0,draw_begin);
//---- indicator buffers mapping
   SetIndexBuffer(0,ExtMapBuffer);
//---- initialization done
   return(0);
  }
//+------------------------------------------------------------------+
//| Custom indicator deinitialization function                       |
//+------------------------------------------------------------------+
int deinit()
  {
//----

//----
   return(0);
  }
//+------------------------------------------------------------------+
//| Custom indicator iteration function                              |
//+------------------------------------------------------------------+
int start() {
   int i, counter;

   double fasterEMAnow, slowerEMAnow, fasterEMAprevious, slowerEMAprevious, fasterEMAafter, slowerEMAafter, cu;
   double Range, AvgRange;
   int counted_bars=IndicatorCounted();
//---- check for possible errors
   if(counted_bars<0) return(-1);
//---- last counted bar will be recounted
   if(counted_bars>0) counted_bars--;
   int limit = Bars-counted_bars-1;
   if (limit > AllBars) limit = AllBars;

   for(i=limit; i > 0; i--) {

      counter=i;
      Range=0;
      AvgRange=0;

      for (counter=i ;counter<=i+9;counter++)
      {
         AvgRange=AvgRange+MathAbs(High[counter]-Low[counter]);
      }
      Range=AvgRange/10;

      fasterEMAnow = iMA(NULL, 0, FasterEMA, 0, MODE_EMA, PRICE_CLOSE, i);
      fasterEMAprevious = iMA(NULL, 0, FasterEMA, 0, MODE_EMA, PRICE_CLOSE, i+1);
      fasterEMAafter = iMA(NULL, 0, FasterEMA, 0, MODE_EMA, PRICE_CLOSE, i-1);

      slowerEMAnow = iMA(NULL, 0, SlowerEMA, 0, MODE_EMA, PRICE_CLOSE, i);
      slowerEMAprevious = iMA(NULL, 0, SlowerEMA, 0, MODE_EMA, PRICE_CLOSE, i+1);
      slowerEMAafter = iMA(NULL, 0, SlowerEMA, 0, MODE_EMA, PRICE_CLOSE, i-1);

      if ((fasterEMAnow > slowerEMAnow) && (fasterEMAprevious < slowerEMAprevious) && (fasterEMAafter > slowerEMAafter)) {
         CrossUp[i] = Low[i] - Range*0.5;
//       if(limit<=2)
//            {
//            Alert (Symbol()," ",Period(),"-Min. BUY Crossed Up at ",  CrossUp[i]);
//            }

      }
      else if ((fasterEMAnow < slowerEMAnow) && (fasterEMAprevious > slowerEMAprevious) && (fasterEMAafter < slowerEMAafter)) {
         CrossDown[i] = High[i] + Range*0.5;

//        if(limit<=2)
//           {
//          Alert (Symbol()," ",Period(),"-Min. SELL Crossed Down at ",  CrossDown[i]);
//         }

      }
   }
   return(0);
}
Comments