[i]OBVmod_v1
Download script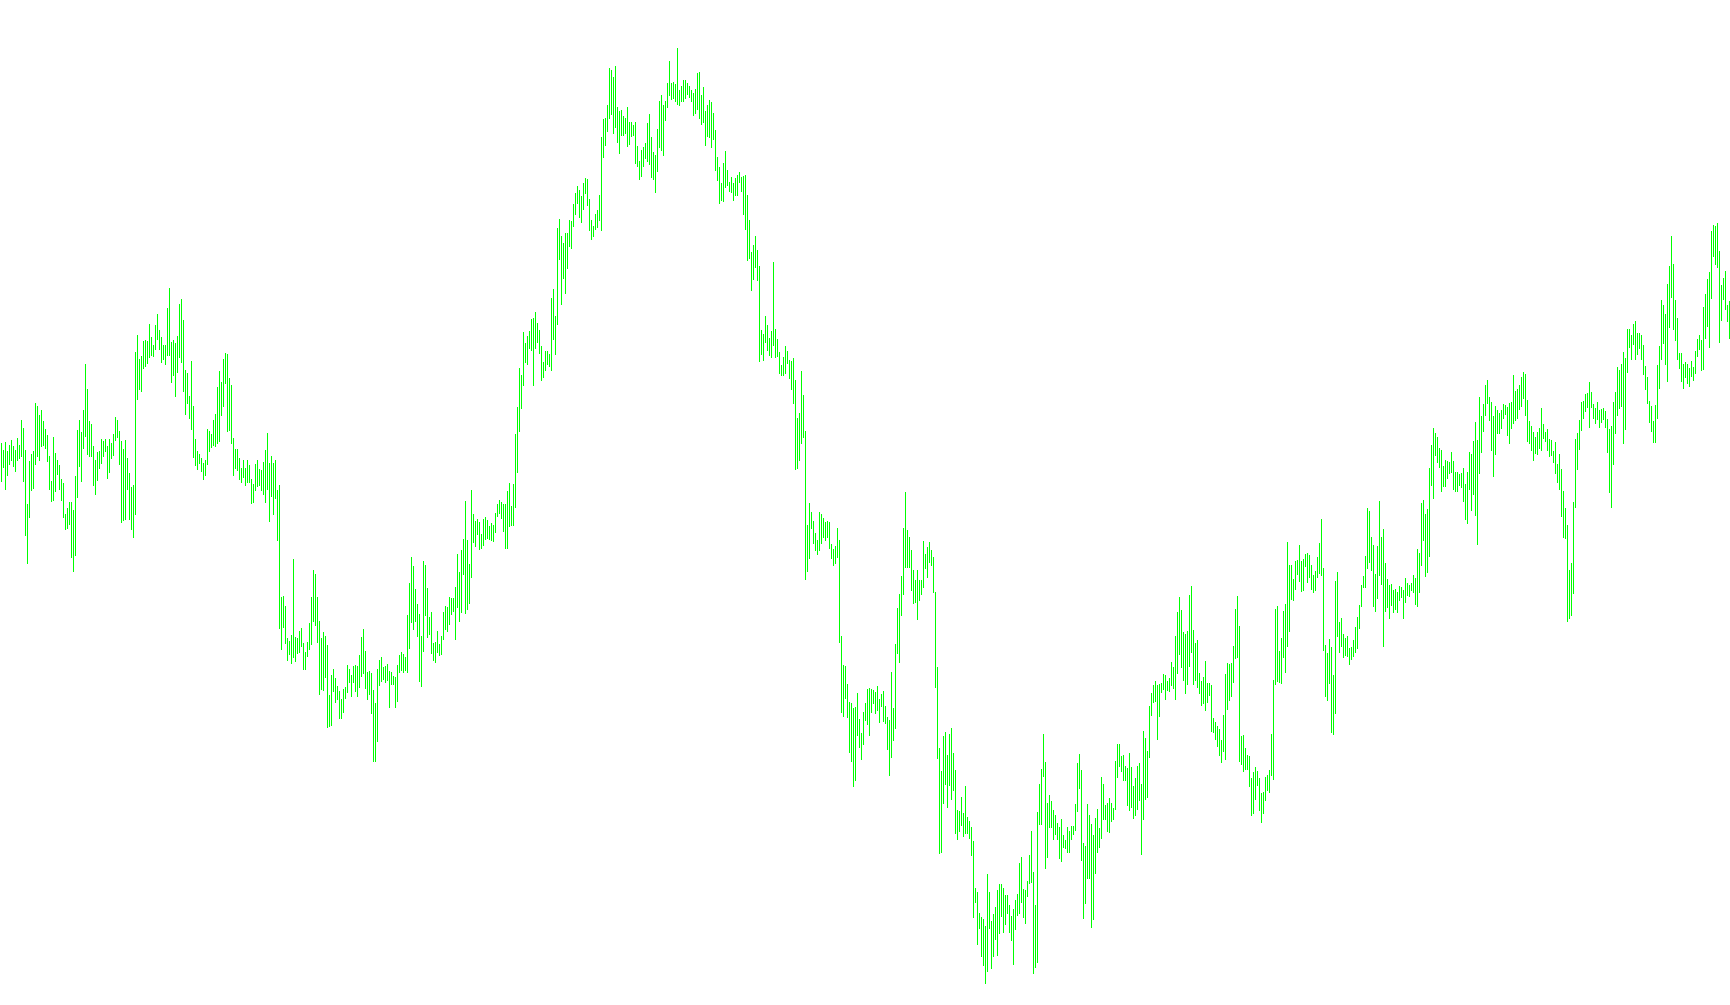
This tool is designed to provide traders with a visual representation of market sentiment by analyzing the relationship between trading volume and price movement. Instead of just looking at how much an asset is being traded, it attempts to determine whether that volume is being driven by "buying" pressure or "selling" pressure over time.
How the Logic Works
The script operates by scanning the historical price data of a financial instrument. For every candle (time period) on the chart, it performs three specific steps:
1. Price Movement Analysis The indicator first looks at the previous closing price compared to the current closing price. It determines if the price moved up or down and calculates the exact size of that move. This "gain or loss" figure identifies the direction of the price action.
2. Volume Weighting Next, the tool retrieves the volume data for that same period. Rather than treating all volume equally, it multiplies the amount of volume traded by the magnitude of the price change calculated in the previous step.
3. Cumulative Balance Calculation This is the core logic of the indicator:
- If the price moved up, the weighted volume is added to a running total (representing positive momentum).
- If the price moved down, the weighted volume is subtracted from that same running total (representing negative momentum).
The Visual Result
The final output is a continuous line displayed in a separate window below your main chart.
- Upward Trend: When the line climbs, it indicates that buying pressure is dominating the market activity relative to the price movement.
- Downward Trend: When the line falls, it suggests that selling pressure is outweighing buying activity.
- Trend Shifts: Sudden changes in the direction of the line can alert a trader to a potential shift in market sentiment, helping to identify whether the current price move is backed by strong volume or if the momentum is fading.
/*-----------------------------+
|			       |
| Shared by www.Aptrafx.com    |
|			       |
+------------------------------*/

//+-----------------------------------+
//| On Balance Volume with price bias |
//+-----------------------------------+
#property copyright "Ron Thompson"
#property link      "http://www.lightpatch.com/forex/"

#property indicator_separate_window
#property indicator_buffers 1

#property indicator_color1 White

//---- buffers
double Buffer1[];

//+------------------------------------------------------------------+
//| Custom indicator initialization function                         |
//|------------------------------------------------------------------|

int init()
  {

   SetIndexStyle(0,DRAW_LINE);
   SetIndexBuffer(0, Buffer1);

  }


//+------------------------------------------------------------------+
//| Custor indicator deinitialization function                       |
//+------------------------------------------------------------------+
int deinit()
  {
  }


//+------------------------------------------------------------------+
//| Custom indicator iteration function                              |
//+------------------------------------------------------------------+


int start()
  {

   double p=Point();

   int      pos=Bars-100;
   int      ctr=0;

   double  vol0,    vol1;
   double  vaccum;

   double  close0,  close1;
   double  gainloss;

   while(pos>=0)
     {

      vol1=Volume[pos+1];
      vol0=Volume[pos];

      close1=Close[pos+1];
      close0=Close[pos];

      if (close0>close1) gainloss=(close0-close1)/p;
      if (close0<close1) gainloss=(close1-close0)/p;

      if (close0>close1) vaccum=vaccum+(vol0*gainloss);
      if (close0<close1) vaccum=vaccum-(vol0*gainloss);

      Buffer1[pos]=vaccum;

 	   pos--;
     }

   return(0);
  }
//+------------------------------------------------------------------+
Comments