[i]OBVmod
Download script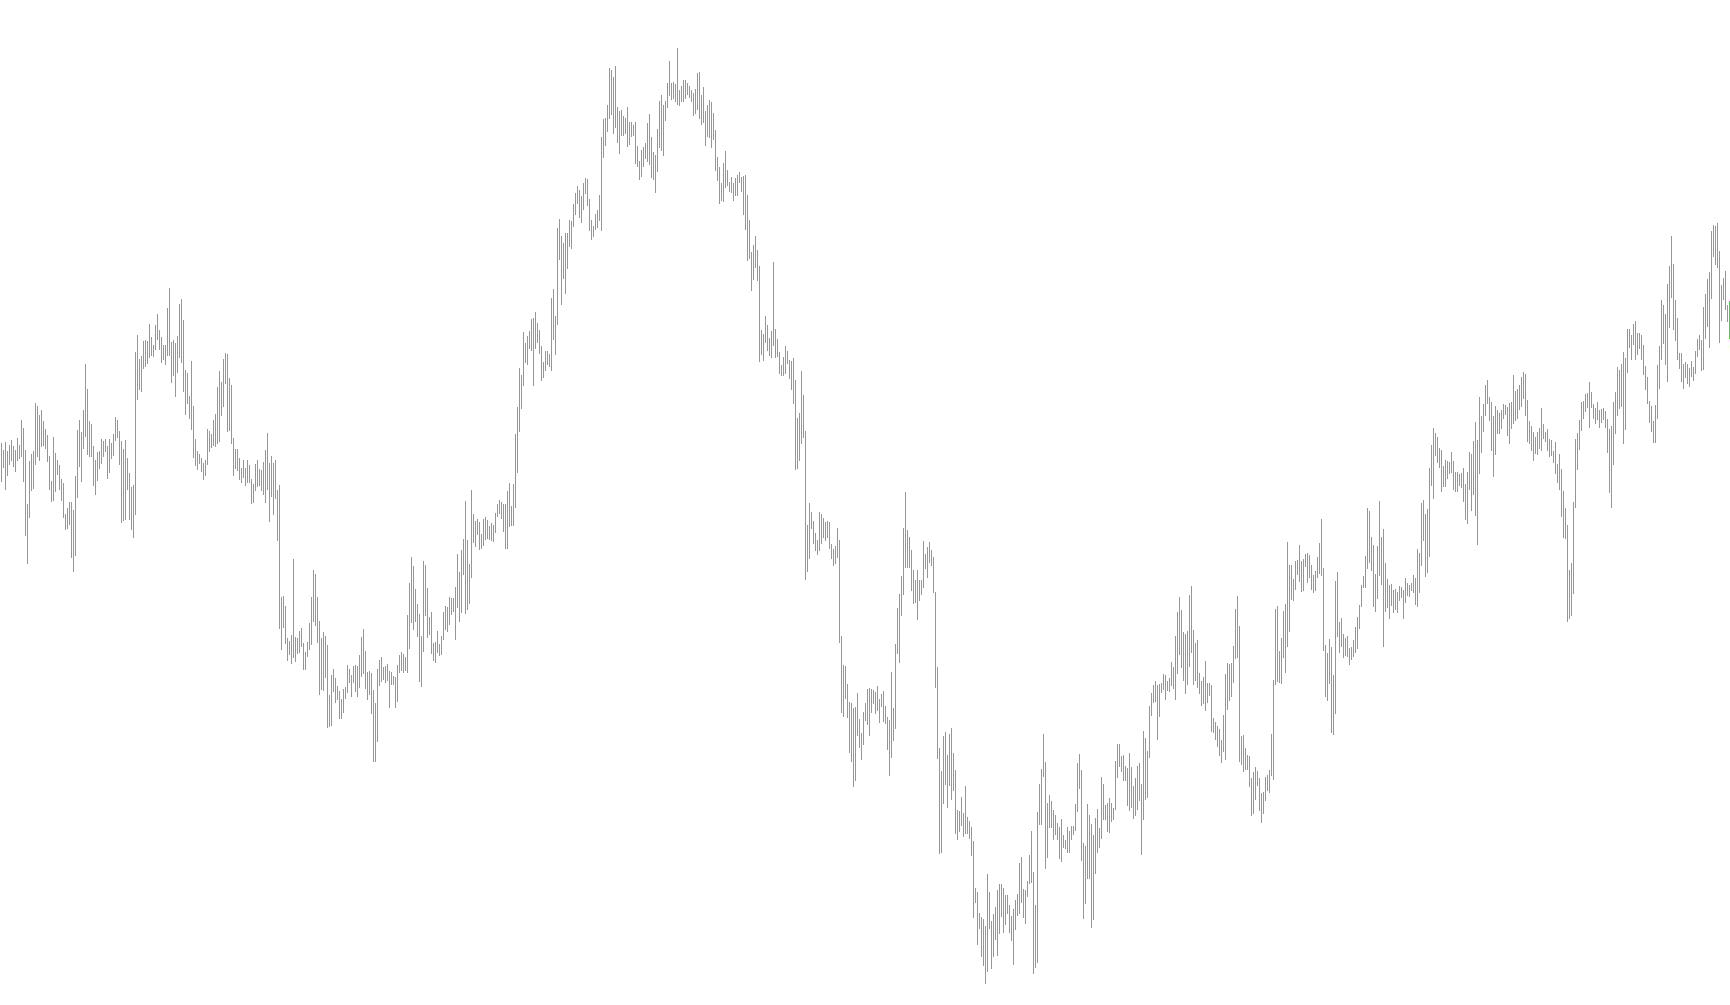
This tool is designed to provide a visual representation of market momentum by combining two key trading concepts: trading volume and price movement direction. Instead of simply showing how much trading activity is occurring, it weighs that activity against whether the price is moving up or down, helping to distinguish between "strong" moves and "weak" moves.
How the Logic Works:
The script works by scanning through recent historical data to calculate a cumulative value based on three specific factors:
- Price Movement (Gain/Loss): The tool first looks at the difference in price between one completed candle and the next. It calculates the magnitude of this change, determining how far the price moved in a specific direction.
- Volume Weighting: It then takes the trading volume (the amount of activity) from that same period. By multiplying the volume by the price movement, the tool identifies which moves have the most "weight" behind them. For example, a large price jump on high volume is treated as a much more significant event than a small price move on low volume.
- Directional Bias: The logic applies a positive or negative sign to these weighted values based on the direction of the price. If the price closed higher than it opened, the value is added; if it closed lower, the value is subtracted.
The Final Result:
The indicator creates a running total (a cumulative "vacuum" of volume) over time. On your chart, this appears as a continuous line that rises when buyers are aggressively pushing the price up and falls when sellers are dominant in pushing the price down.
By viewing this line, you can see the underlying "pressure" in the market. It helps filter out market noise by emphasizing significant movements supported by high volume while de-emphasizing minor fluctuations, allowing for a clearer view of the prevailing trend's strength.
//+-----------------------------------+
//| On Balance Volume with price bias |
//+-----------------------------------+
#property copyright "Ron Thompson"
#property link      "http://www.lightpatch.com/forex/"

#property indicator_separate_window
#property indicator_buffers 1

#property indicator_color1 White

//---- buffers
double Buffer1[];

//+------------------------------------------------------------------+
//| Custom indicator initialization function                         |
//|------------------------------------------------------------------|

int init()
  {

   SetIndexStyle(0,DRAW_LINE);
   SetIndexBuffer(0, Buffer1);

  }


//+------------------------------------------------------------------+
//| Custor indicator deinitialization function                       |
//+------------------------------------------------------------------+
int deinit()
  {
  }


//+------------------------------------------------------------------+
//| Custom indicator iteration function                              |
//+------------------------------------------------------------------+


int start()
  {

   double p=Point();

   int      pos=Bars-100;
   int      ctr=0;

   double  vol0,    vol1;
   double  vaccum;

   double  close0,  close1;
   double  gainloss;

   while(pos>=0)
     {

      vol1=Volume[pos+1];
      vol0=Volume[pos];

      close1=Close[pos+1];
      close0=Close[pos];

      if (close0>close1) gainloss=(close0-close1)/p;
      if (close0<close1) gainloss=(close1-close0)/p;

      if (close0>close1) vaccum=vaccum+(vol0*gainloss);
      if (close0<close1) vaccum=vaccum-(vol0*gainloss);

      Buffer1[pos]=vaccum;

 	   pos--;
     }

   return(0);
  }
//+------------------------------------------------------------------+
Comments