HMA_Momentum_Test1
Download script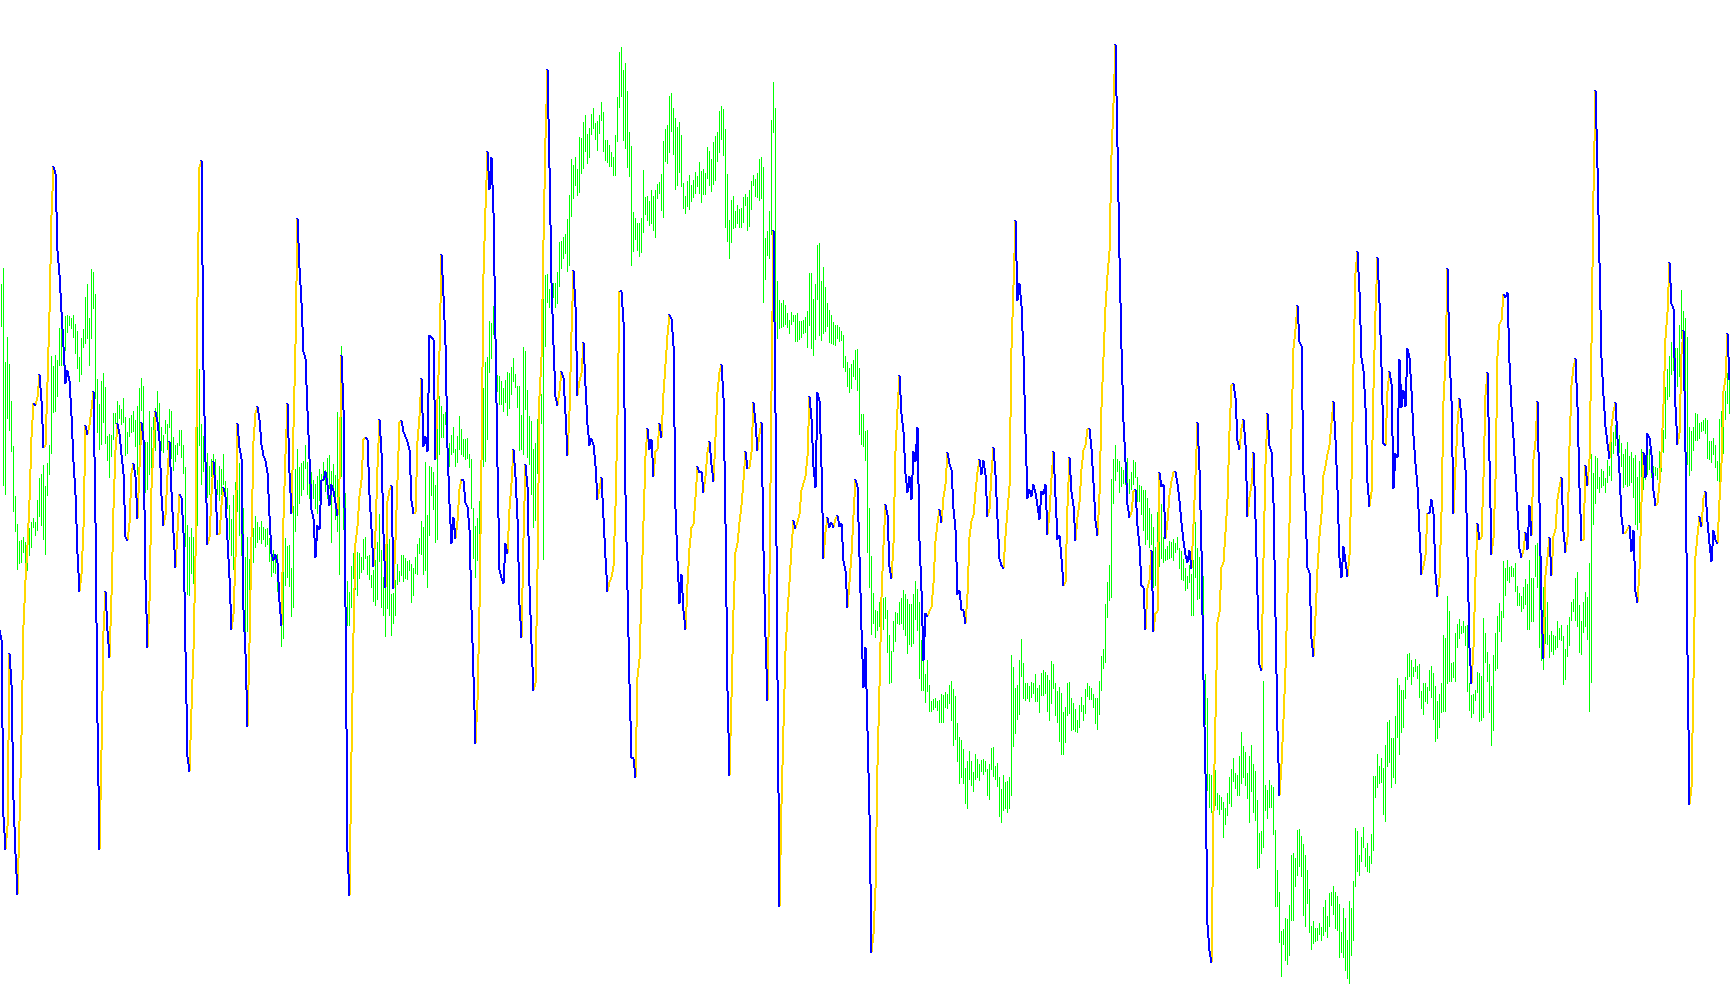
This indicator is designed to help traders visualize and identify momentum shifts in the market by focusing on price velocity and trend direction. It operates in a separate window below your main chart, providing a clear visual representation of the underlying market "energy."
Core Logic Overview
The tool works through a multi-layered calculation process to filter out market noise and highlight significant movements:
1. Momentum Calculation Instead of looking at raw price alone, the script first calculates a weighted momentum value. It does this by comparing two different moving averages: one calculated over a shorter timeframe and another over a longer timeframe. By doubling the short-term average and subtracting the long-term average, the indicator isolates the "velocity" of the price movement.
2. Trend Smoothing Once the momentum is calculated, the script applies an additional layer of processing to smooth out minor fluctuations. This ensures that small, insignificant price wobbles don't trigger false signals. It seeks to identify the broader "flow" of the market rather than every tiny price tick.
3. Visual Trend Identification The script then categorizes the market into two distinct states based on whether the momentum is increasing or decreasing:
- Uptrend: When the momentum values are rising, the indicator tracks this as a positive trend (represented by the Aqua line).
- Downtrend: When the momentum values are falling, the indicator tracks this as a negative trend (represented by the Red line).
How it appears on your chart
The primary visual output is the transition between these two colors. Because the script specifically handles "Trend Changes," it highlights the specific points where the market shifts from positive momentum to negative momentum (or vice versa).
By looking at the separation and movement of these lines, traders can better perceive whether the current price action has enough strength to continue its direction or if the momentum is beginning to exhaust and reverse.
/*-----------------------------+
|			       |
| Shared by www.Aptrafx.com    |
|			       |
+------------------------------*/

//+------------------------------------------------------------------+
//|                                           HMA_Momentum_Test1.mq4 |
//|                                                              HMA |
//|                Copyright © 2006 WizardSerg <wizardserg@mail.ru>, |
//|                                    ?? ??????? ForexMagazine #104 |
//|                                               wizardserg@mail.ru |
//|                         Revised by IgorAD,igorad2003@yahoo.co.uk |
//|                                        http://www.forex-tsd.com/ |
//+------------------------------------------------------------------+

#property copyright "Reconfigured by General Public"
#property link      "Everyones@Planet.Earth"

#property indicator_separate_window

#property indicator_buffers 2

#property indicator_color1 Aqua
#property indicator_color2 Red

#property indicator_maximum 100.5
#property indicator_minimum 99.5
#property indicator_level1 100

//---- input parameters

extern int       period=14;
extern int       method=1;                         // 0 = MODE_SMA
extern int       price=0;                          // 0 = PRICE_CLOSE
extern int       width=2;
//extern string    Sound_File="alert2.wav";

//---- buffers

double Uptrend[];
double Dntrend[];
double ExtMapBuffer[];


//+------------------------------------------------------------------+
//| Custom indicator initialization function                         |
//+------------------------------------------------------------------+
int init()
{
    IndicatorBuffers(3);
    SetIndexBuffer(0, Uptrend);

    SetIndexBuffer(1, Dntrend);

    SetIndexBuffer(2, ExtMapBuffer);
    ArraySetAsSeries(ExtMapBuffer, true);

    SetIndexStyle(0,DRAW_LINE,STYLE_SOLID,width);
    SetIndexStyle(1,DRAW_LINE,STYLE_SOLID,width);

    IndicatorShortName(" HMA_Momentum_Test1 ( "+period+" )");
    return(0);
}

//+------------------------------------------------------------------+
//| Custor indicator deinitialization function                       |
//+------------------------------------------------------------------+

int deinit()
{
    return(0);
}

//+------------------------------------------------------------------+
//|                                                                  |
//+------------------------------------------------------------------+

double WMA(int x, int p)
{
    return(iMA(Symbol(), 0, p, 0, method, price, x));
}

//+------------------------------------------------------------------+
//| Custom indicator iteration function                              |
//+------------------------------------------------------------------+

int start()
{
    int counted_bars = IndicatorCounted();

    if(counted_bars < 0)
        return(-1);

    int x = 0;
    int p = MathSqrt(period);
    int e = Bars - counted_bars + period + 1;

    double vect[], trend[];

    if(e > Bars) e = Bars;

    ArrayResize(vect, e);
    ArraySetAsSeries(vect, true);
    ArrayResize(trend, e);
    ArraySetAsSeries(trend, true);

    for(x = 0; x < e; x++)
    {
        vect[x] = 2*WMA(x, period/2) - WMA(x, period);
    }

    for(x = 0; x < e-period; x++)

        ExtMapBuffer[x] = iMomentumOnArray(vect, 0, p, x);

    for(x = e-period; x >= 0; x--)
    {
        trend[x] = trend[x+1];
        if (ExtMapBuffer[x]> ExtMapBuffer[x+1]) trend[x] =1;
        if (ExtMapBuffer[x]< ExtMapBuffer[x+1]) trend[x] =-1;

    if (trend[x]>0)
    { Uptrend[x] = ExtMapBuffer[x];
      if (trend[x+1]<0) {
      Uptrend[x+1]=ExtMapBuffer[x+1];
      //PlaySound(Sound_File);
      }
      Dntrend[x] = EMPTY_VALUE;

    }
    else
    if (trend[x]<0)
    {
      Dntrend[x] = ExtMapBuffer[x];
      if (trend[x+1]>0) {
      Dntrend[x+1]=ExtMapBuffer[x+1];
      //PlaySound(Sound_File);
      }

      Uptrend[x] = EMPTY_VALUE;

    }

   }

  return(0);
}
//+------------------------------------------------------------------+
Comments