_T_S_R__Signal_Line
Download script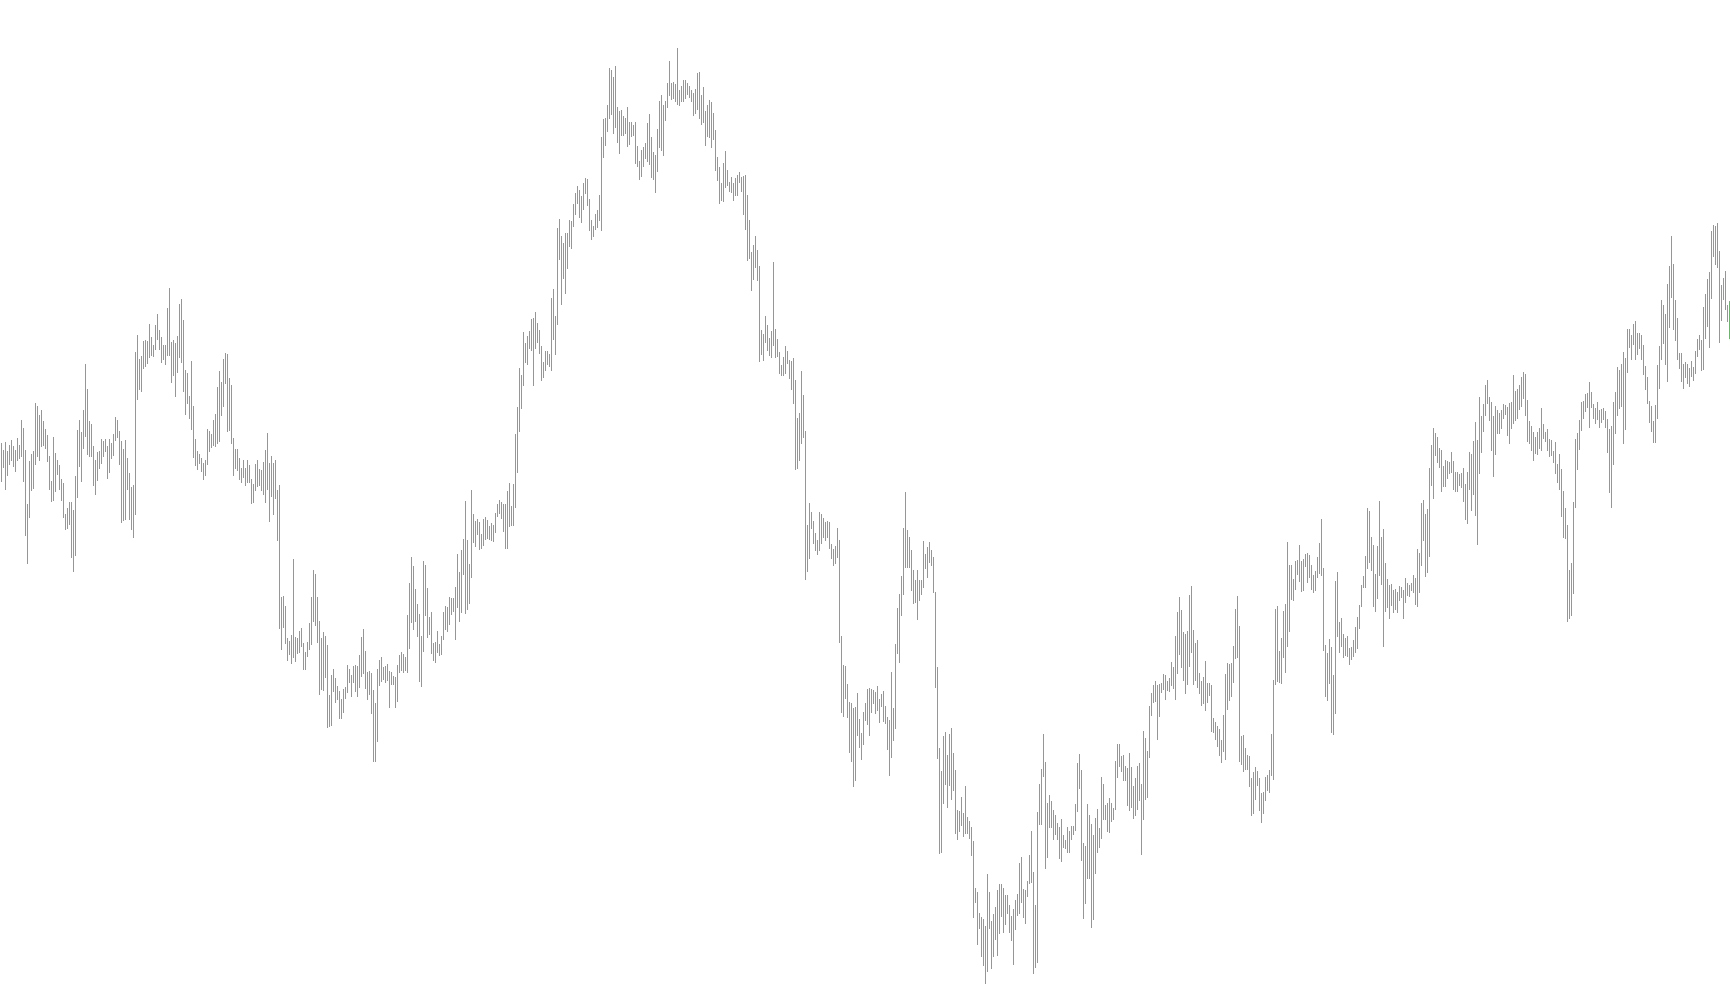
This tool is designed to help traders identify and visualize market trends more clearly by smoothing out "market noise" and identifying specific directions of movement. It works by calculating a sophisticated moving average that reacts quickly to price changes while maintaining a smooth visual flow.
Core Logic and Behavior
1. Multi-Layered Smoothing Instead of simply tracking the current price, the script uses a mathematical approach called a "Hull Moving Average" logic. It performs several layers of calculations:
- First, it calculates a moving average based on half of your chosen timeframe.
- It then compares that against a standard moving average of the full timeframe.
- Finally, it applies a second smoothing pass to ensure the resulting line isn't erratic or jagged.
This multi-step process ensures that the resulting signal is less likely to be "tricked" by tiny, insignificant price fluctuations, while still being responsive enough to capture meaningful trend shifts.
2. Trend Detection The script constantly monitors the "slope" of the calculated line. By looking at whether the current value is higher or lower than the previous one, it determines the immediate momentum:
- Upward Momentum: When the smoothed line moves upward, the script identifies this as a positive trend.
- Downward Momentum: When the smoothed line moves downward, it identifies this as a negative trend.
3. Visual Output To make the data easy to read on a chart, the script separates these movements into two distinct visual elements:
- Uptrend: It plots a specific line (colored Blue by default) when the market is showing positive momentum.
- Downtrend: It plots a separate line (colored Red by default) when the market is showing negative momentum.
Summary for the Trader
The primary goal of this script is to simplify your view of the market. Rather than forcing you to interpret raw, jagged price action, it filters the data into two clear signals. When you see the blue line active, the logic suggests an upward trend; when you see the red line active, it suggests a downward trend. It essentially "cleans" the chart so you can focus on the overall direction of the market.
//+------------------------------------------------------------------+
//| HMA.mq4
//| Copyright © 2006 WizardSerg <wizardserg@mail.ru>, ?? ??????? ForexMagazine #104
//| wizardserg@mail.ru
//| Revised by IgorAD,igorad2003@yahoo.co.uk |
//| Personalized by iGoR AKA FXiGoR for the Trend Slope Trading method (T_S_T)
//| Link:
//| contact: thefuturemaster@hotmail.com
//+------------------------------------------------------------------+
#property copyright "MT4 release WizardSerg <wizardserg@mail.ru>, ?? ??????? ForexMagazine #104"
#property link      "wizardserg@mail.ru"

#property indicator_chart_window
#property indicator_buffers 2
#property indicator_color1 Blue
#property indicator_color2 Red
//---- input parameters
extern int       period=50;
extern int       method=3;                         // MODE_SMA
extern int       price=0;                          // PRICE_CLOSE
//---- buffers
double Uptrend[];
double Dntrend[];
double ExtMapBuffer[];


//+------------------------------------------------------------------+
//| Custom indicator initialization function                         |
//+------------------------------------------------------------------+
int init()
{
    IndicatorBuffers(3);
    SetIndexBuffer(0, Uptrend);
    //ArraySetAsSeries(Uptrend, true);
    SetIndexBuffer(1, Dntrend);
    //ArraySetAsSeries(Dntrend, true);
    SetIndexBuffer(2, ExtMapBuffer);
    ArraySetAsSeries(ExtMapBuffer, true);

    SetIndexStyle(0,DRAW_LINE,STYLE_SOLID,2);
    SetIndexStyle(1,DRAW_LINE,STYLE_SOLID,2);

    IndicatorShortName("Signal Line("+period+")");
    return(0);
}

//+------------------------------------------------------------------+
//| Custor indicator deinitialization function                       |
//+------------------------------------------------------------------+
int deinit()
{
    // ???? ????? ?????? ??????
    return(0);
}

//+------------------------------------------------------------------+
//| ?????????? ???????                                               |
//+------------------------------------------------------------------+
double WMA(int x, int p)
{
    return(iMA(NULL, 0, p, 0, method, price, x));
}

//+------------------------------------------------------------------+
//| Custom indicator iteration function                              |
//+------------------------------------------------------------------+
int start()
{
    int counted_bars = IndicatorCounted();

    if(counted_bars < 0)
        return(-1);

    int x = 0;
    int p = MathSqrt(period);
    int e = Bars - counted_bars + period + 1;

    double vect[], trend[];

    if(e > Bars)
        e = Bars;

    ArrayResize(vect, e);
    ArraySetAsSeries(vect, true);
    ArrayResize(trend, e);
    ArraySetAsSeries(trend, true);

    for(x = 0; x < e; x++)
    {
        vect[x] = 2*WMA(x, period/2) - WMA(x, period);
 //       Print("Bar date/time: ", TimeToStr(Time[x]), " close: ", Close[x], " vect[", x, "] = ", vect[x], " 2*WMA(p/2) = ", 2*WMA(x, period/2), " WMA(p) = ",  WMA(x, period));
    }

    for(x = 0; x < e-period; x++)

        ExtMapBuffer[x] = iMAOnArray(vect, 0, p, 0, method, x);

    for(x = e-period; x >= 0; x--)
    {
        trend[x] = trend[x+1];
        if (ExtMapBuffer[x]> ExtMapBuffer[x+1]) trend[x] =1;
        if (ExtMapBuffer[x]< ExtMapBuffer[x+1]) trend[x] =-1;

    if (trend[x]>0)
    { Uptrend[x] = ExtMapBuffer[x];
      if (trend[x+1]<0) Uptrend[x+1]=ExtMapBuffer[x+1];
      Dntrend[x] = EMPTY_VALUE;
    }
    else
    if (trend[x]<0)
    {
      Dntrend[x] = ExtMapBuffer[x];
      if (trend[x+1]>0) Dntrend[x+1]=ExtMapBuffer[x+1];
      Uptrend[x] = EMPTY_VALUE;
    }

    //Comment( " trend=",trend[x]);
    //Comment("Down: ",Dntrend[x], "  Up: ",Uptrend[x]);
    }

    return(0);
}
//+------------------------------------------------------------------+
Comments