HistogramINDI
Download script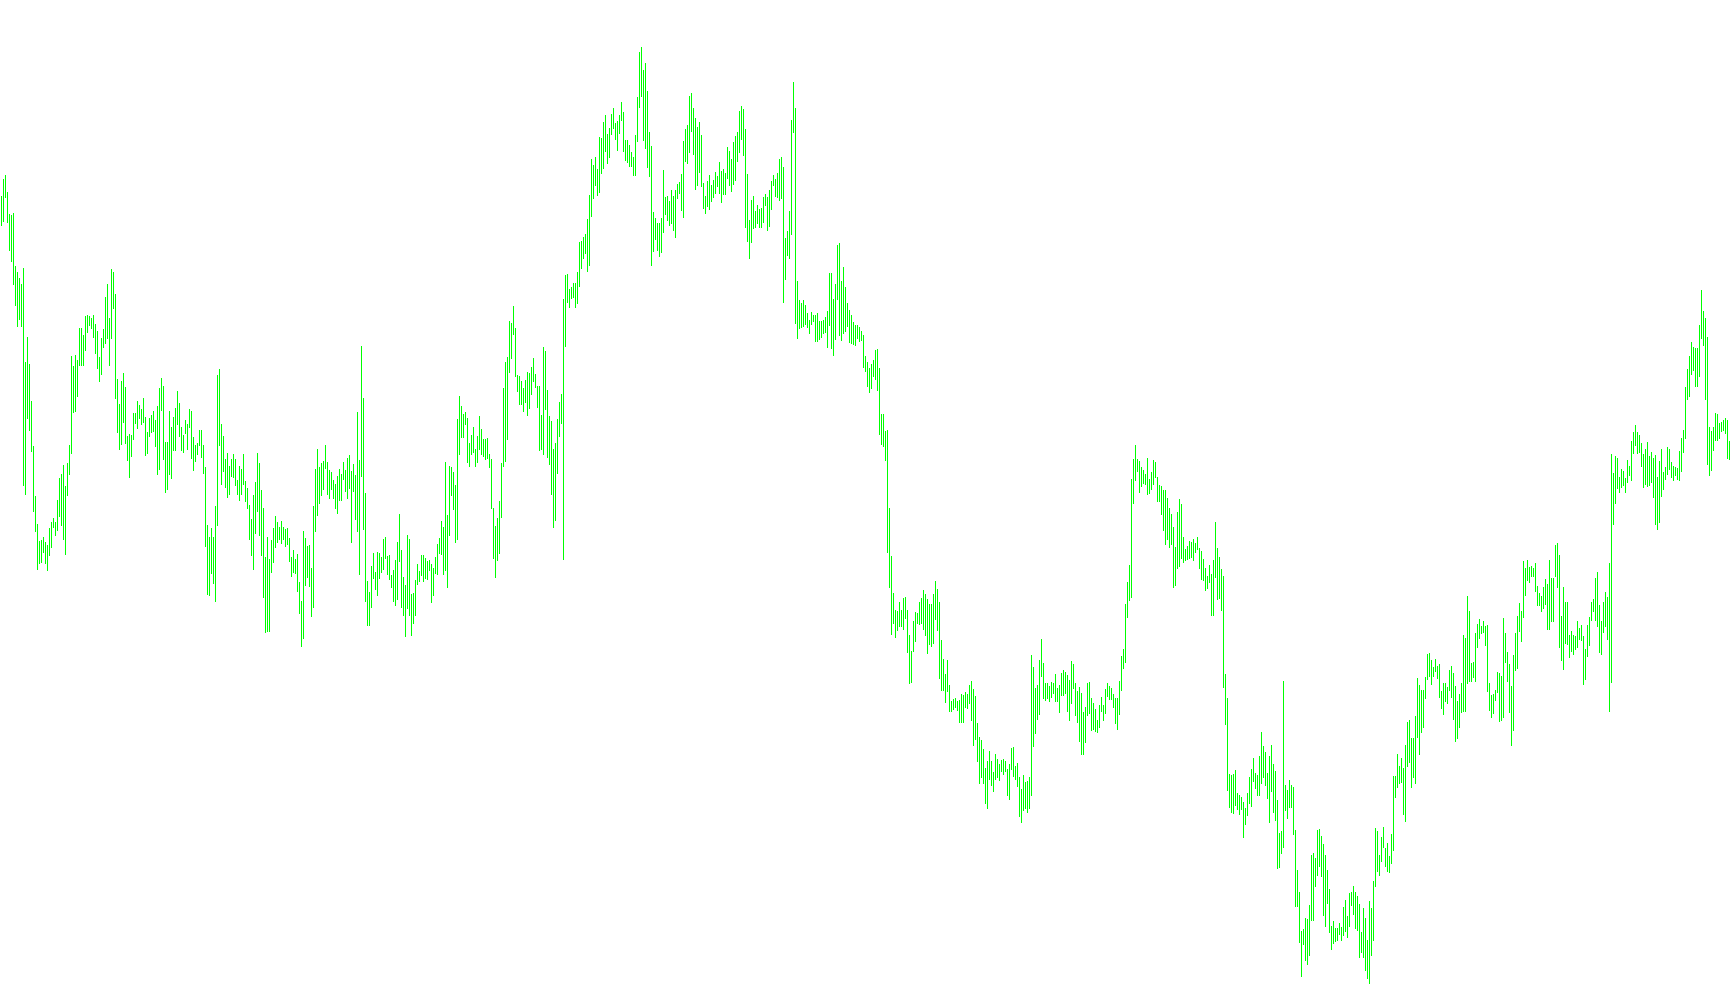
This tool is a specialized technical analysis indicator designed to help traders identify and visualize market trends by analyzing the "slope" or momentum of price movements. Rather than simply showing where the price is currently located, it focuses on the direction and velocity of the trend to provide clearer signals.
Core Logic Overview
The script operates through a multi-layered calculation process to filter out market "noise" and highlight significant shifts in direction:
1. Weighted Movement Calculation The tool begins by processing price data through a weighted moving average. It specifically looks at the relationship between two different timeframes (a full period and a half-period). By calculating the difference between these two averages, the script generates a "vector." This helps isolate the momentum of the market—essentially identifying if the price is accelerating or decelerating in a specific direction.
2. Signal Smoothing Once the initial vector is created, the tool applies an additional smoothing pass. It takes the square root of the primary period to determine the ideal balance for this secondary calculation. This step is crucial because it prevents the indicator from reacting too aggressively to minor price fluctuations, ensuring that only sustained movements are captured.
3. Trend Detection and Mapping The script then compares the current smoothed value against the previous one to determine the "Trend."
- If the value is rising, it identifies an upward movement.
- If the value is falling, it identifies a downward movement.
4. Visual Representation The final output is displayed as a histogram in a separate window on your trading chart. The logic distinguishes between two primary states:
- Uptrend: When the trend is positive, the tool populates an "Uptrend" buffer.
- Downtrend: When the trend is negative, it populates a "Dntrend" buffer.
How to Interpret the Results
The indicator acts as a visual guide for market sentiment. By displaying these trends in distinct colors (Red and Aqua), it allows you to see exactly when the momentum shifts from bullish to bearish. It effectively "maps" the trend, providing a cleaner, more readable version of the market's path than standard price charts might show on their own.
//+------------------------------------------------------------------+
//| HMA.mq4
//| Copyright © 2006 WizardSerg <wizardserg@mail.ru>, ?? ??????? ForexMagazine #104
//| wizardserg@mail.ru
//| Revised by IgorAD,igorad2003@yahoo.co.uk |
//| Personalized by iGoR AKA FXiGoR for the Trend Slope Trading method (T_S_T)
//| Link:
//| contact: thefuturemaster@hotmail.com
//+------------------------------------------------------------------+
#property copyright "MT4 release WizardSerg <wizardserg@mail.ru>, ?? ??????? ForexMagazine #104"
#property link      "wizardserg@mail.ru"

#property indicator_separate_window
#property indicator_buffers 2
#property indicator_color1 Red  //DeepSkyBlue  //Aqua
#property indicator_color2 Aqua
//---- input parameters
extern int       period=15;
extern int       method=3;                         // MODE_SMA
extern int       price=0;                          // PRICE_CLOSE
//---- buffers
/*
double Uptrend[];
double Dntrend[];
double ExtMapBuffer[];
double ExtHBuffer1[];
double ExtHBuffer2[];
*/
double Uptrend[];
double Dntrend[];
double ExtMapBuffer[];
double ExtMapBuffer1[];
double ExtMapBuffer2[];
double ExtHBuffer1[];
double ExtHBuffer2[];


//+------------------------------------------------------------------+
//| Custom indicator initialization function                         |
//+------------------------------------------------------------------+

int init()
{
    IndicatorBuffers(5);
    SetIndexBuffer(0, Uptrend);
    //ArraySetAsSeries(Uptrend, true);
    SetIndexBuffer(1, Dntrend);
    //ArraySetAsSeries(Dntrend, true);
    SetIndexBuffer(3, ExtMapBuffer);
    ArraySetAsSeries(ExtMapBuffer, true);

    SetIndexStyle(0,DRAW_HISTOGRAM);
       SetIndexBuffer(0,ExtHBuffer1);
    SetIndexStyle(1,DRAW_HISTOGRAM);
       SetIndexBuffer(1,ExtHBuffer2);

    IndicatorShortName("Signal Line("+period+")");
    return(0);
}
/*
int init()
  {
//---- indicators
    IndicatorBuffers(4);
    SetIndexBuffer(0, Uptrend);
    //ArraySetAsSeries(Uptrend, true);
    SetIndexBuffer(1, Dntrend);
    //ArraySetAsSeries(Dntrend, true);
   IndicatorBuffers(4);
   SetIndexStyle(0,DRAW_HISTOGRAM,0,2);  //Red
   SetIndexBuffer(0,ExtHBuffer1);
   SetIndexStyle(1,DRAW_HISTOGRAM,0,2);  //Aqua
   SetIndexBuffer(1,ExtHBuffer2);

   SetIndexBuffer(2,ExtMapBuffer1);
   SetIndexBuffer(3,ExtMapBuffer2);

   IndicatorShortName("Signal Line("+period+")");

//----
   return(0);
  }
*/
//+------------------------------------------------------------------+
//| Custor indicator deinitialization function                       |
//+------------------------------------------------------------------+
int deinit()
{
    // ???? ????? ?????? ??????
    return(0);
}

//+------------------------------------------------------------------+
//| ?????????? ???????                                               |
//+------------------------------------------------------------------+
double WMA(int x, int p)
{
    return(iMA(NULL, 0, p, 0, method, price, x));
}

//+------------------------------------------------------------------+
//| Custom indicator iteration function                              |
//+------------------------------------------------------------------+
int start()
{
    int counted_bars = IndicatorCounted();

    if(counted_bars < 0)
        return(-1);

    int x = 0;
    int p = MathSqrt(period);
    int e = Bars - counted_bars + period + 1;

    double vect[], trend[];

    if(e > Bars)
        e = Bars;

    ArrayResize(vect, e);
    ArraySetAsSeries(vect, true);
    ArrayResize(trend, e);
    ArraySetAsSeries(trend, true);

    for(x = 0; x < e; x++)
    {
        vect[x] = 2*WMA(x, period/2) - WMA(x, period);
 //       Print("Bar date/time: ", TimeToStr(Time[x]), " close: ", Close[x], " vect[", x, "] = ", vect[x], " 2*WMA(p/2) = ", 2*WMA(x, period/2), " WMA(p) = ",  WMA(x, period));
    }

    for(x = 0; x < e-period; x++)

        ExtMapBuffer[x] = iMAOnArray(vect, 0, p, 0, method, x);

    for(x = e-period; x >= 0; x--)
    {
        trend[x] = trend[x+1];
        if (ExtMapBuffer[x]> ExtMapBuffer[x+1]) trend[x] =1;
        if (ExtMapBuffer[x]< ExtMapBuffer[x+1]) trend[x] =-1;

    if (trend[x]>0)
    { Uptrend[x] = ExtMapBuffer[x];
      if (trend[x+1]<0) Uptrend[x+1]=ExtMapBuffer[x+1];
      Dntrend[x] = EMPTY_VALUE;
    }
    else
    if (trend[x]<0)
    {
      Dntrend[x] = ExtMapBuffer[x];
      if (trend[x+1]>0) Dntrend[x+1]=ExtMapBuffer[x+1];
      Uptrend[x] = EMPTY_VALUE;
    }

    //Print( " trend=",trend[x]);
    }

    return(0);
}
//+------------------------------------------------------------------+
Comments