HMA_Russian_Color_sep_v2
Download script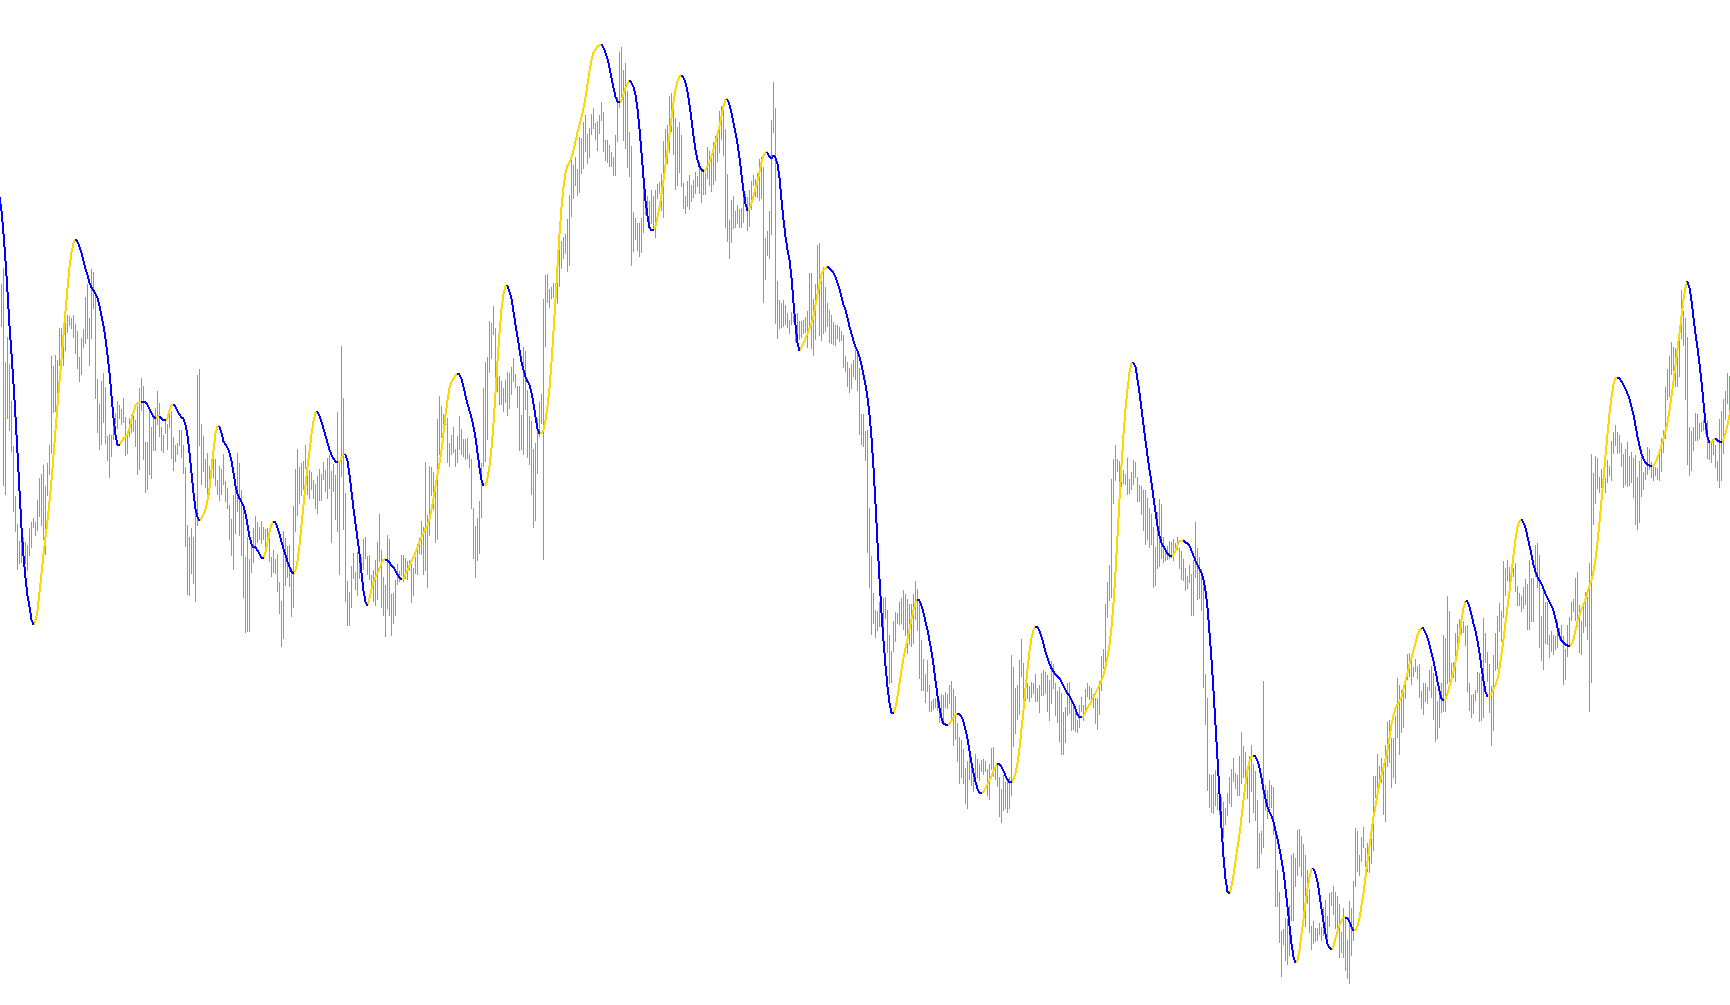
This script functions as a specialized technical analysis tool designed to identify and visualize price trends more smoothly and quickly than standard moving averages. It utilizes the "Hull Moving Average" logic, which is engineered to reduce the inherent time lag typically found in traditional momentum indicators.
Core Logic and Methodology
The tool processes market data through a multi-layered mathematical sequence to achieve its visual output:
- Dynamic Smoothing: Instead of calculating a simple average of past prices, the script first creates an intermediate calculation. It takes a weighted moving average of a shorter timeframe (half of your chosen period) and combines it with a moving average of the full period. This specific combination is designed to "capture" price movements more aggressively while filtering out minor market noise.
- Vectorization: The script then applies a secondary smoothing pass over these intermediate calculations. By calculating a weighted moving average on the previously smoothed data, the tool creates a refined curve that stays closer to the actual price action than standard indicators.
- Trend Identification: Once the final smoothed line is generated, the script analyzes the direction of the curve. It constantly compares the current value of the line against its previous position to determine whether the momentum is moving upward or downward.
Visual Output and Interpretation
The tool provides a clear visual distinction between different market states rather than just displaying a single continuous line:
- Upward Momentum: When the smoothed curve identifies a positive trend, it plots a specific line (colored Aqua in the settings). This signals to the user that the prevailing momentum is bullish.
- Downward Momentum: When the curve identifies a negative trend, it switches to a different line (colored Tomato). This signals a bearish shift in price action.
- Transition Handling: The logic includes a "hand-off" mechanism. When the trend flips from positive to negative (or vice versa), the script ensures that the final point of the previous trend is preserved. This creates a connected visual experience on your chart, allowing you to see exactly where one trend ended and the next began.
Summary for the User
Essentially, this script acts as a "trend follower." It takes raw price data, processes it through three layers of weighted averaging to eliminate lag and noise, and then paints the resulting curve in distinct colors based on whether the market is currently climbing or falling.
//+------------------------------------------------------------------+
//| HMA.mq4
//| Copyright © 2006 WizardSerg <wizardserg@mail.ru>, ?? ??????? ForexMagazine #104
//| wizardserg@mail.ru
//|                         Revised by IgorAD,igorad2003@yahoo.co.uk |
//|                                        http://www.forex-tsd.com/ |
//+------------------------------------------------------------------+
#property copyright "MT4 release WizardSerg <wizardserg@mail.ru>, ?? ??????? ForexMagazine #104"
#property link      "wizardserg@mail.ru"

#property indicator_separate_window
#property indicator_buffers 2
#property indicator_color1 Aqua
#property indicator_color2 Tomato
//---- input parameters
extern int       period=21;
extern int       method=0;                         // MODE_SMA
extern int       price=0;                          // PRICE_CLOSE
//---- buffers
double Uptrend[];
double Dntrend[];
double ExtMapBuffer[];


//+------------------------------------------------------------------+
//| Custom indicator initialization function                         |
//+------------------------------------------------------------------+
int init()
{
    IndicatorBuffers(3);
    SetIndexBuffer(0, Uptrend);
    //ArraySetAsSeries(Uptrend, true);
    SetIndexBuffer(1, Dntrend);
    //ArraySetAsSeries(Dntrend, true);
    SetIndexBuffer(2, ExtMapBuffer);
    ArraySetAsSeries(ExtMapBuffer, true);

    SetIndexStyle(0,DRAW_LINE,STYLE_SOLID,2);
    SetIndexStyle(1,DRAW_LINE,STYLE_SOLID,2);

    IndicatorShortName("Hull Moving Average("+period+")");
    return(0);
}

//+------------------------------------------------------------------+
//| Custor indicator deinitialization function                       |
//+------------------------------------------------------------------+
int deinit()
{
    // ???? ????? ?????? ??????
    return(0);
}

//+------------------------------------------------------------------+
//| ?????????? ???????                                               |
//+------------------------------------------------------------------+
double WMA(int x, int p)
{
    return(iMA(NULL, 0, p, 0, method, price, x));
}

//+------------------------------------------------------------------+
//| Custom indicator iteration function                              |
//+------------------------------------------------------------------+
int start()
{
    int counted_bars = IndicatorCounted();

    if(counted_bars < 0)
        return(-1);

    int x = 0;
    int p = MathSqrt(period);
    int e = Bars - counted_bars + period + 1;

    double vect[], trend[];

    if(e > Bars)
        e = Bars;

    ArrayResize(vect, e);
    ArraySetAsSeries(vect, true);
    ArrayResize(trend, e);
    ArraySetAsSeries(trend, true);

    for(x = 0; x < e; x++)
    {
        vect[x] = 2*WMA(x, period/2) - WMA(x, period);
 //       Print("Bar date/time: ", TimeToStr(Time[x]), " close: ", Close[x], " vect[", x, "] = ", vect[x], " 2*WMA(p/2) = ", 2*WMA(x, period/2), " WMA(p) = ",  WMA(x, period));
    }

    for(x = 0; x < e-period; x++)

        ExtMapBuffer[x] = iMAOnArray(vect, 0, p, 0, method, x);

    for(x = e-period; x >= 0; x--)
    {
        trend[x] = trend[x+1];
        if (ExtMapBuffer[x]> ExtMapBuffer[x+1]) trend[x] =1;
        if (ExtMapBuffer[x]< ExtMapBuffer[x+1]) trend[x] =-1;

    if (trend[x]>0)
    { Uptrend[x] = ExtMapBuffer[x];
      if (trend[x+1]<0) Uptrend[x+1]=ExtMapBuffer[x+1];
      Dntrend[x] = EMPTY_VALUE;
    }
    else
    if (trend[x]<0)
    {
      Dntrend[x] = ExtMapBuffer[x];
      if (trend[x+1]>0) Dntrend[x+1]=ExtMapBuffer[x+1];
      Uptrend[x] = EMPTY_VALUE;
    }

    //Print( " trend=",trend[x]);
    }

    return(0);
}
//+------------------------------------------------------------------+
Comments