(Plagiat)
Download script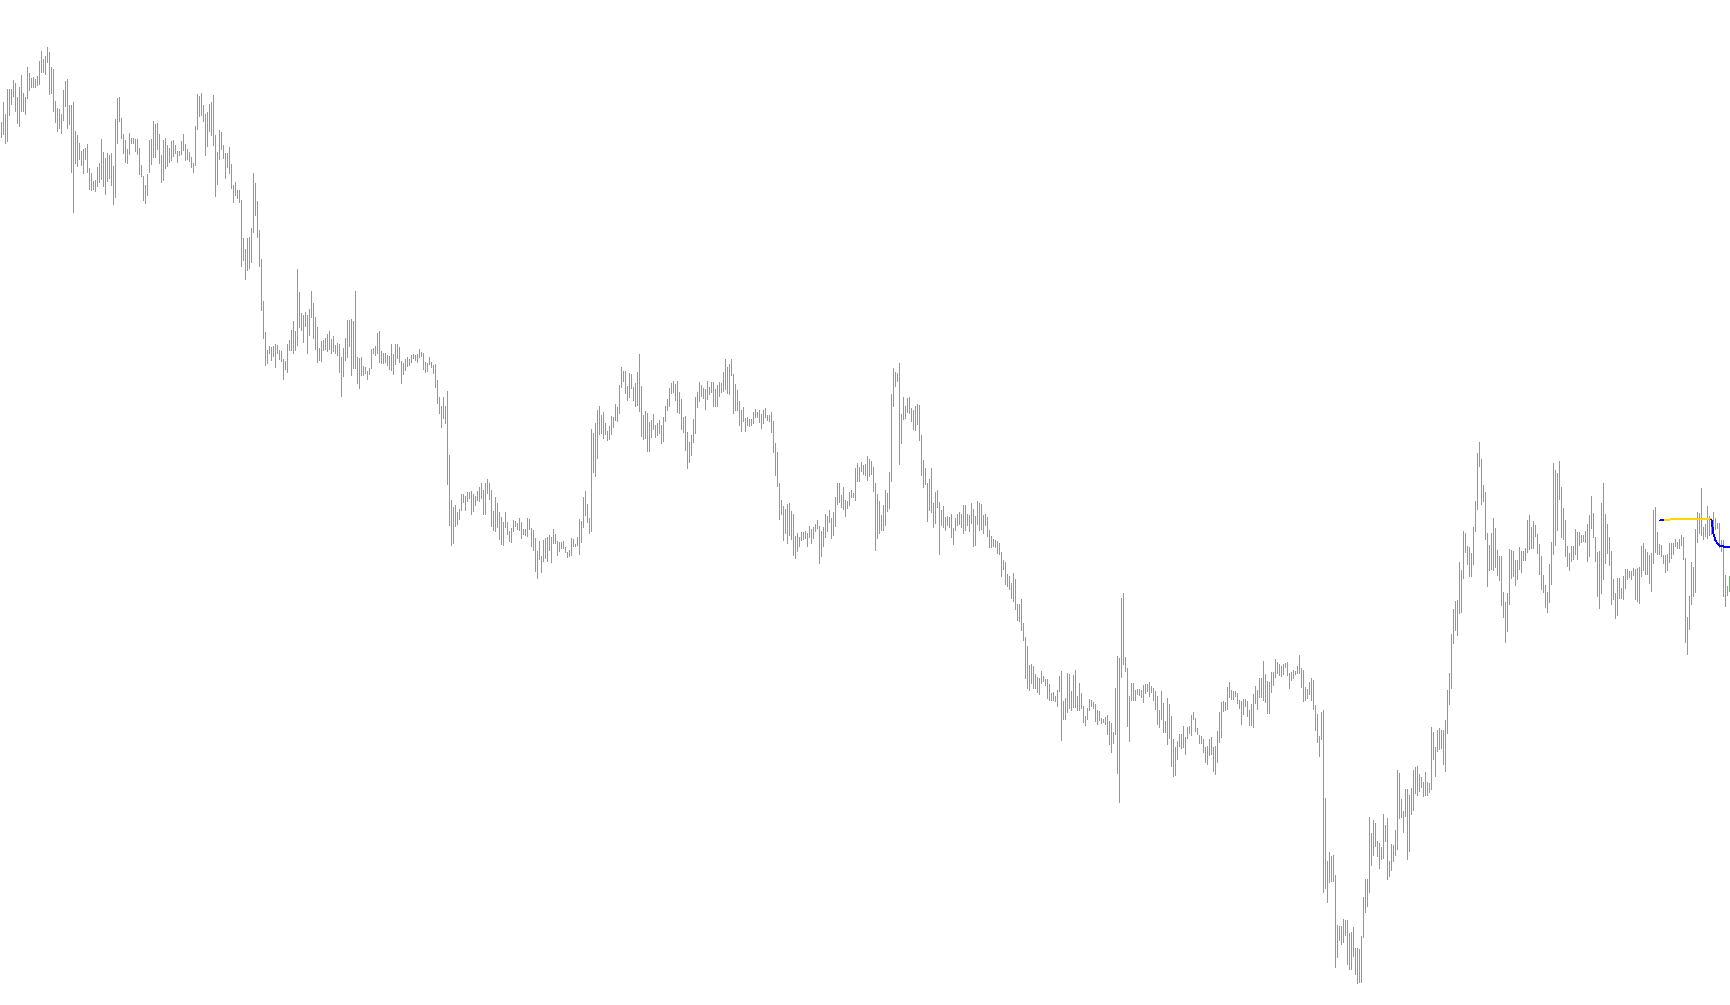
This script is designed as a visual trading tool for MetaTrader, specifically created to help traders identify and visualize market trends more clearly. Rather than just showing a simple moving average, it uses a specialized calculation method to smooth out price noise and highlight the underlying direction of the market.
How the Logic Works
1. Multi-Timeframe Smoothing The script performs a complex "look-back" operation. It doesn't just look at the current minute or hour; depending on the timeframe you are viewing (such as 1 minute, 5 minutes, or 1 hour), it aggregates data across multiple periods to calculate a specialized weighted average. This ensures that the trend line remains stable and isn't easily distracted by small, temporary price fluctuations.
2. The Calculation Engine The core logic uses a mathematical formula that compares two different moving averages (one shorter and one longer). By calculating the difference between these two, the script identifies the "momentum" or "slope" of the price. It then applies an additional layer of smoothing to this result to create a final signal line.
3. Trend Detection and Color Coding The most visible feature for the user is how the script handles upward and downward movements:
- Uptrend Identification: When the calculated signal line moves higher than its previous position, the script identifies this as an uptrend. It highlights these sections in Lime (Green).
- Downtrend Identification: When the signal line moves lower than its previous position, it identifies a downtrend and highlights these sections in Red.
- Transition Logic: The script is designed to "remember" where a trend started. When the trend flips from up to down (or vice versa), it ensures that the final data point of the old trend is captured, providing a clean, continuous visual transition on your chart.
Summary for the Trader
Essentially, this tool acts as a "filter." It takes raw market price data, runs it through a series of mathematical filters to determine the strongest direction of travel, and draws two distinct lines on your screen. This allows you to stay aligned with the prevailing momentum—buying during the Lime sections and selling during the Red sections—while ignoring the "market noise" that often leads to false signals.
//+----------------------------------------------------------------------------+
//| HMA.mq4                                                                    |
//| Copyright © 2006 WizardSerg <wizardserg@mail.ru>, ForexMagazine #104       |
//| wizardserg@mail.ru                                                         |
//| Revised by IgorAD,igorad2003@yahoo.co.uk                                   |
//| Personalized by iGoR AKA FXiGoR for the Trend Slope Trading method (T_S_T) |
//| Link:                                                                      |
//| contact: thefuturemaster@hotmail.com                                       |
//+----------------------------------------------------------------------------+
#property copyright "È maloma ðóêó ïðèëîæèë :)"
//#property copyright "MT4 release WizardSerg <wizardserg@mail.ru>,ForexMagazine #104"
//#property link      "wizardserg@mail.ru"
#property indicator_chart_window
#property indicator_buffers 2
#property indicator_color1 Lime
#property indicator_color2 Red
//---- input parameters
extern int       period=5;//15;
int       method=2;//3;                         // MODE_SMA
int       price=5;//0;                          // PRICE_CLOSE
int       y=0;
//---- buffers
double Uptrend[];
double Dntrend[];
double ExtMapBuffer[];
//+------------------------------------------------------------------+
//|                                                                  |
//+------------------------------------------------------------------+
int init()
  {
   IndicatorBuffers(3);
   SetIndexBuffer(0, Uptrend);
   //ArraySetAsSeries(Uptrend, true);
   SetIndexBuffer(1, Dntrend);
   //ArraySetAsSeries(Dntrend, true);
   SetIndexBuffer(2, ExtMapBuffer);
   ArraySetAsSeries(ExtMapBuffer, true);
   SetIndexStyle(0,DRAW_LINE,STYLE_SOLID,2);
   SetIndexStyle(1,DRAW_LINE,STYLE_SOLID,2);
   IndicatorShortName("Signal Line("+period+")");
   return(0);
  }
//+------------------------------------------------------------------+
//|                                                                  |
//+------------------------------------------------------------------+
int deinit()
  {
   return(0);
  }
//+------------------------------------------------------------------+
//|                                                                  |
//+------------------------------------------------------------------+
double WMA(int x, int p)
  {
   return(iMA(NULL, PERIOD_D1, p, 0, method, price, x));
  }
//+------------------------------------------------------------------+
//|                                                                  |
//+------------------------------------------------------------------+
int start()
  {
   if (Period()>1440) return(0);
   int counted_bars=IndicatorCounted();
   if(counted_bars < 0)
      return(-1);
   int x=0;
   int p=MathSqrt(period);
   int e=iBars(Symbol(),PERIOD_D1) - counted_bars + period + 1;
//----
   double vect[], trend[];
//----
   if(e > iBars(Symbol(),PERIOD_D1))
      e=iBars(Symbol(),PERIOD_D1);
//----
   ArrayResize(vect, e);
   ArraySetAsSeries(vect, true);
   ArrayResize(trend, e);
   ArraySetAsSeries(trend, true);
//----
   if (Period()==1) for(x=0; x < e; x++) for(y=x*1440;y<=x*1440+1439;y++) vect[y]=2*WMA(x, period/2) - WMA(x, period);
   if (Period()==5) for(x=0; x < e; x++) for(y=x*288;y<=x*288+287;y++) vect[y]=2*WMA(x, period/2) - WMA(x, period);
   if (Period()==15) for(x=0; x < e; x++) for(y=x*96;y<=x*96+95;y++) vect[y]=2*WMA(x, period/2) - WMA(x, period);
   if (Period()==30) for(x=0; x < e; x++) for(y=x*48;y<=x*48+47;y++) vect[y]=2*WMA(x, period/2) - WMA(x, period);
   if (Period()==60) for(x=0; x < e; x++) for(y=x*24;y<=x*24+23;y++) vect[y]=2*WMA(x, period/2) - WMA(x, period);
   if (Period()==240) for(x=0; x < e; x++) for(y=x*6;y<=x*6+5;y++) vect[y]=2*WMA(x, period/2) - WMA(x, period);
   if (Period()==1440) for(x=0; x < e; x++) for(y=x;y<=x;y++) vect[y]=2*WMA(x, period/2) - WMA(x, period);
//----
   for(x=0; x < e-period; x++)
      ExtMapBuffer[x]=iMAOnArray(vect, 0, p, 0, method, x);
   for(x=e-period; x>=0; x--)
     {
      trend[x]=trend[x+1];
      if (ExtMapBuffer[x]> ExtMapBuffer[x+1]) trend[x] =1;
      if (ExtMapBuffer[x]< ExtMapBuffer[x+1]) trend[x] =-1;
      if (trend[x]>0)
        { Uptrend[x]=ExtMapBuffer[x];
         if (trend[x+1]<0) Uptrend[x+1]=ExtMapBuffer[x+1];
         Dntrend[x]=EMPTY_VALUE;
        }
      else
         if (trend[x]<0)
           {
            Dntrend[x]=ExtMapBuffer[x];
            if (trend[x+1]>0) Dntrend[x+1]=ExtMapBuffer[x+1];
            Uptrend[x]=EMPTY_VALUE;
           }
      //Print( " trend=",trend[x]);
     }
   return(0);
  }
//+------------------------------------------------------------------+
Comments