StepMA_Color_v2_v2
Download script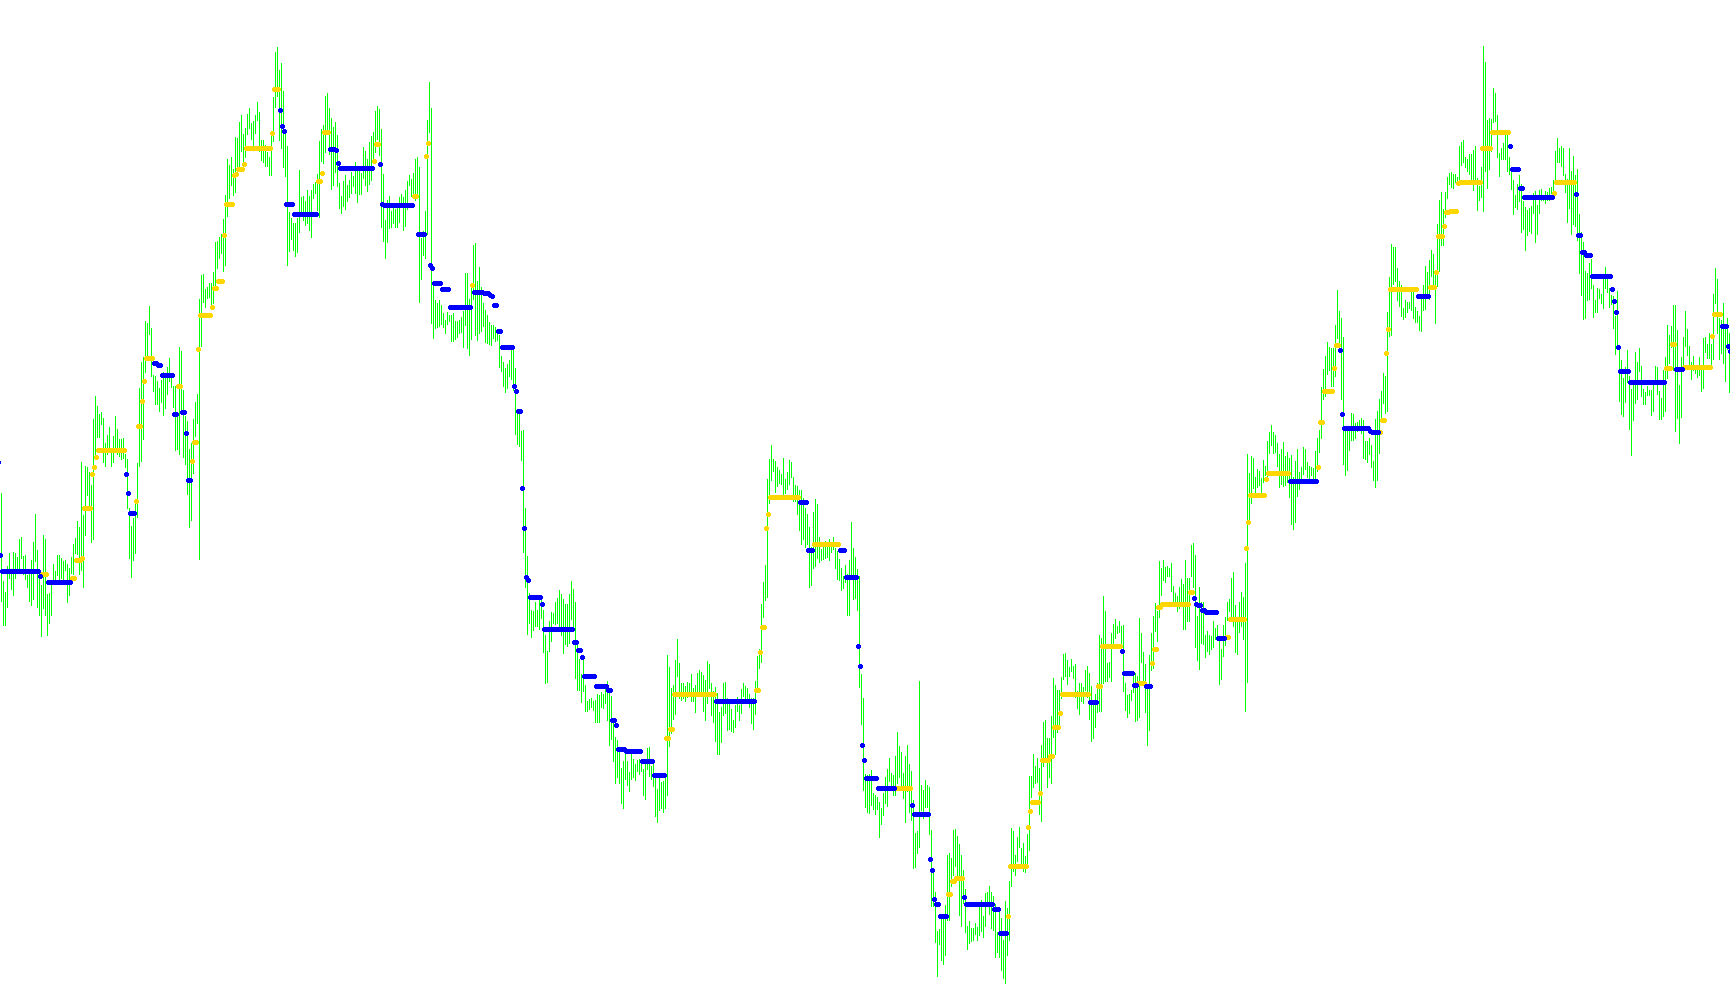
The StepMA Color indicator is a technical analysis tool designed to identify and visualize market trends by filtering out minor price fluctuations. Unlike standard moving averages that create smooth, continuous lines, this script operates on a "stepped" logic, creating distinct visual levels that help traders see the primary direction of the market more clearly.
Core Operational Logic
The indicator functions based on three primary stages:
1. Volatility Measurement (The Step Size) Before determining the trend, the tool calculates the market's current volatility. It looks back over a specific period (defined by the user) to analyze the range between highs and lows. By averaging these movements, it establishes a "Step Size." This ensures that the indicator adapts to the market environment; in highly volatile periods, the steps are larger, and in calmer markets, the steps become smaller and more precise.
2. Trend Detection The script continuously monitors price action to decide whether the market is in an upward or downward state. It establishes "thresholds" based on the calculated Step Size.
- Bullish Trend: If the price breaks above a certain upper threshold, the indicator recognizes an upward trend.
- Bearish Trend: If the price breaks below a certain lower threshold, it recognizes a downward trend.
The logic is designed to be "sticky." Once a trend is established, the indicator maintains that direction until a significant price movement—large enough to overcome the calculated Step Size—forces a shift in the opposite direction. This prevents the indicator from flickering or changing direction due to insignificant "noise" or minor price wobbles.
3. Visual Mapping The final output is displayed as specific markers on your chart:
- Upward Trends: Represented by blue markers, showing the current floor of the price movement.
- Downward Trends: Represented by red markers, showing the current ceiling of the price movement.
Summary for Traders
By using this logic, the indicator simplifies complex price action into a binary "Step" system. It helps you stay on the right side of the market by highlighting significant structural shifts while ignoring the minor fluctuations that often lead to false signals in traditional moving averages.
/*-----------------------------+
|			       |
| Shared by www.Aptrafx.com    |
|			       |
+------------------------------*/

//+------------------------------------------------------------------+
//|                                              StepMA_Color_v2.mq4 |
//|                           Copyright © 2005, TrendLaboratory Ltd. |
//|                                       E-mail: igorad2004@list.ru |
//+------------------------------------------------------------------+
#property copyright "Copyright © 2005, TrendLaboratory Ltd."
#property link      "E-mail: igorad2004@list.ru"

#property indicator_chart_window
#property indicator_buffers 2
#property indicator_color1 Blue
#property indicator_color2 Red
//---- input parameters
extern int PeriodWATR=100;
extern double Kwatr=1.0000;
extern int Advance=0;
extern int HighLow=0;
//---- indicator buffers
double UpBuffer[];
double DownBuffer[];
//+------------------------------------------------------------------+
//| Custom indicator initialization function                         |
//+------------------------------------------------------------------+
  int init()
  {
   string short_name;
//---- indicator line
   SetIndexStyle(0,DRAW_ARROW);
   SetIndexStyle(1,DRAW_ARROW);
   SetIndexArrow(0,159);
   SetIndexArrow(1,159);
   SetIndexShift(0,Advance);
   SetIndexShift(1,Advance);
   SetIndexBuffer(0,UpBuffer);
   SetIndexBuffer(1,DownBuffer);
   IndicatorDigits(MarketInfo(Symbol(),MODE_DIGITS));
//---- name for DataWindow and indicator subwindow label
   short_name="StepMA("+PeriodWATR+")";
   IndicatorShortName(short_name);
   SetIndexLabel(0,"UpTrendStepMA");
   SetIndexLabel(1,"DownTrendStepMA");
//----
   SetIndexDrawBegin(0,PeriodWATR);
   SetIndexDrawBegin(1,PeriodWATR);
//----
   return(0);
  }

//+------------------------------------------------------------------+
//| StepMA_v2                                                         |
//+------------------------------------------------------------------+
int start()
  {
   int i,shift,trend;
   double smin0,smax0,smin1,smax1,AvgRange,dK,WATR;

   AvgRange=0;
	for (i=PeriodWATR-1;i>=0;i--)
	    {
       dK = 1+(PeriodWATR-i)/PeriodWATR;
       AvgRange=AvgRange+ dK*MathAbs(High[i]-Low[i]);
       }
	WATR = AvgRange/PeriodWATR;
	int StepSize=Kwatr*WATR/Point;
	Comment(" StepSize = ", StepSize);


   for(shift=Bars-1;shift>=0;shift--)
   {
	if (HighLow>0)
	  {
	  smax0=Low[shift]+2*StepSize*Point;
	  smin0=High[shift]-2*StepSize*Point;

	  if(Close[shift]>smax1) trend=1;
	  if(Close[shift]<smin1) trend=-1;
	  }

	if (HighLow == 0)
	  {
	  smax0=Close[shift]+2*StepSize*Point;
	  smin0=Close[shift]-2*StepSize*Point;

	  if (Close[shift]>smax1)  trend=1;
	  if (Close[shift]<smin1)  trend=-1;
	  }

	  if(trend>0 && smin0<smin1) smin0=smin1;
	  if(trend<0 && smax0>smax1) smax0=smax1;

	  if (trend>0)
	  {
	  UpBuffer[shift]=smin0+StepSize*Point;
	  DownBuffer[shift]=-1.0;
	  }
	  if (trend<0)
	  {
	  DownBuffer[shift]=smax0-StepSize*Point;
	  UpBuffer[shift]=-1.0;
	  }

	  smin1=smin0;
	  smax1=smax0;
	 }
	return(0);
 }
Comments