StepMA_Color_v2_v1
Download script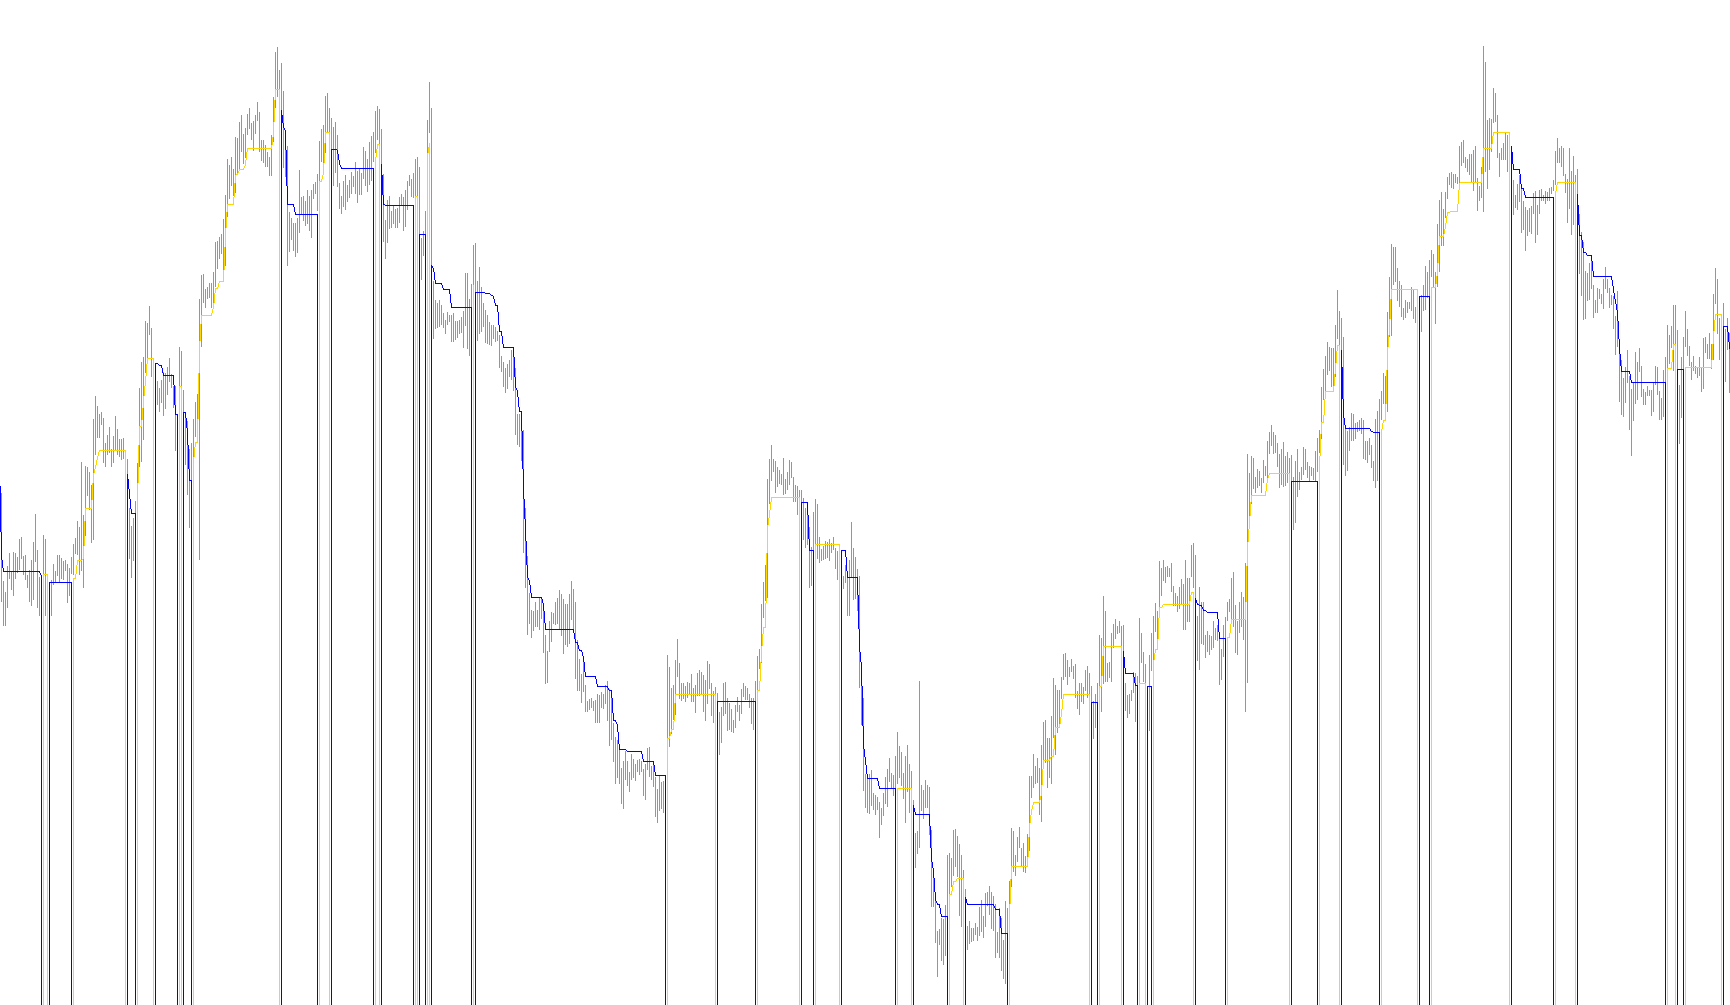
This tool is a specialized technical indicator designed to identify and visualize market trends by calculating "steps" based on price volatility. Rather than following every minor fluctuation in the market, it focuses on significant movements, helping traders distinguish between active trend shifts and minor noise.
Core Logic Overview
1. Volatility-Based Step Calculation The script begins by analyzing a specific window of historical data (defined by the user). It looks at the range between the highest and lowest prices reached during this period. By calculating the average of these ranges, the tool determines the "Step Size." This means that if the market is very volatile, the steps will be larger; if the market is relatively calm, the steps will be smaller. This allows the indicator to adapt automatically to different market conditions.
2. Trend Identification and Filtering The logic works by tracking whether the price is moving significantly enough to break out of its current "step" range. It maintains a memory of the previous boundaries to ensure that the trend only changes when the price moves beyond a specific distance (the Step Size).
- Upward Trend: If the current price closes above the upper boundary established by the volatility calculation, the tool identifies an upward trend.
- Downward Trend: If the current price closes below the lower boundary, it identifies a downward trend.
3. Boundary Management A key feature of this logic is its "stickiness." It doesn't just look at the current price in isolation; it compares the new potential boundaries against the previous ones. This ensures that the trend line doesn't move backward or jump erratically. The indicator effectively "locks" the boundary until a significant enough price movement forces it to create a new step in the direction of the current trend.
Visual Representation
The script produces two distinct lines on your chart:
- UpTrendStepMA: This appears when the market is trending upward, providing a visual floor for the price action.
- DownTrendStepMA: This appears when the market is trending downward, providing a visual ceiling for the price action.
By using this logic, the indicator provides a smoothed, "stepped" representation of market direction, making it easier to see the primary path of price movement without being distracted by minor price spikes.
//+------------------------------------------------------------------+
//|                                              StepMA_Color_v2.mq4 |
//|                           Copyright © 2005, TrendLaboratory Ltd. |
//|                                       E-mail: igorad2004@list.ru |
//+------------------------------------------------------------------+
#property copyright "Copyright © 2005, TrendLaboratory Ltd."
#property link      "E-mail: igorad2004@list.ru"

#property indicator_chart_window
#property indicator_buffers 2
#property indicator_color1 Blue
#property indicator_color2 Red
//---- input parameters
extern int PeriodWATR=100;
extern double Kwatr=1.0000;
extern int Advance=0;
extern int HighLow=0;
//---- indicator buffers
double UpBuffer[];
double DownBuffer[];
//+------------------------------------------------------------------+
//| Custom indicator initialization function                         |
//+------------------------------------------------------------------+
  int init()
  {
   string short_name;
//---- indicator line
   SetIndexStyle(0,DRAW_LINE);
   SetIndexStyle(1,DRAW_LINE);
   SetIndexArrow(0,159);
   SetIndexArrow(1,159);
   SetIndexShift(0,Advance);
   SetIndexShift(1,Advance);
   SetIndexBuffer(0,UpBuffer);
   SetIndexBuffer(1,DownBuffer);
   IndicatorDigits(MarketInfo(Symbol(),MODE_DIGITS));
//---- name for DataWindow and indicator subwindow label
   short_name="StepMA("+PeriodWATR+")";
   IndicatorShortName(short_name);
   SetIndexLabel(0,"UpTrendStepMA");
   SetIndexLabel(1,"DownTrendStepMA");
//----
   SetIndexDrawBegin(0,PeriodWATR);
   SetIndexDrawBegin(1,PeriodWATR);
//----
   return(0);
  }

//+------------------------------------------------------------------+
//| StepMA_v2                                                         |
//+------------------------------------------------------------------+
int start()
  {
   int i,shift,trend;
   double smin0,smax0,smin1,smax1,AvgRange,dK,WATR;

   AvgRange=0;
	for (i=PeriodWATR-1;i>=0;i--)
	    {
       dK = 1+(PeriodWATR-i)/PeriodWATR;
       AvgRange=AvgRange+ dK*MathAbs(High[i]-Low[i]);
       }
	WATR = AvgRange/PeriodWATR;
	int StepSize=Kwatr*WATR/Point;
	Comment(" StepSize = ", StepSize);


   for(shift=Bars-1;shift>=0;shift--)
   {
	if (HighLow>0)
	  {
	  smax0=Low[shift]+2*StepSize*Point;
	  smin0=High[shift]-2*StepSize*Point;

	  if(Close[shift]>smax1) trend=1;
	  if(Close[shift]<smin1) trend=-1;
	  }

	if (HighLow == 0)
	  {
	  smax0=Close[shift]+2*StepSize*Point;
	  smin0=Close[shift]-2*StepSize*Point;

	  if (Close[shift]>smax1)  trend=1;
	  if (Close[shift]<smin1)  trend=-1;
	  }

	  if(trend>0 && smin0<smin1) smin0=smin1;
	  if(trend<0 && smax0>smax1) smax0=smax1;

	  if (trend>0)
	  {
	  UpBuffer[shift]=smin0+StepSize*Point;
	  DownBuffer[shift]=-1.0;
	  }
	  if (trend<0)
	  {
	  DownBuffer[shift]=smax0-StepSize*Point;
	  UpBuffer[shift]=-1.0;
	  }

	  smin1=smin0;
	  smax1=smax0;
	 }
	return(0);
 }
Comments