StepMA_Color_v2_v3
Download script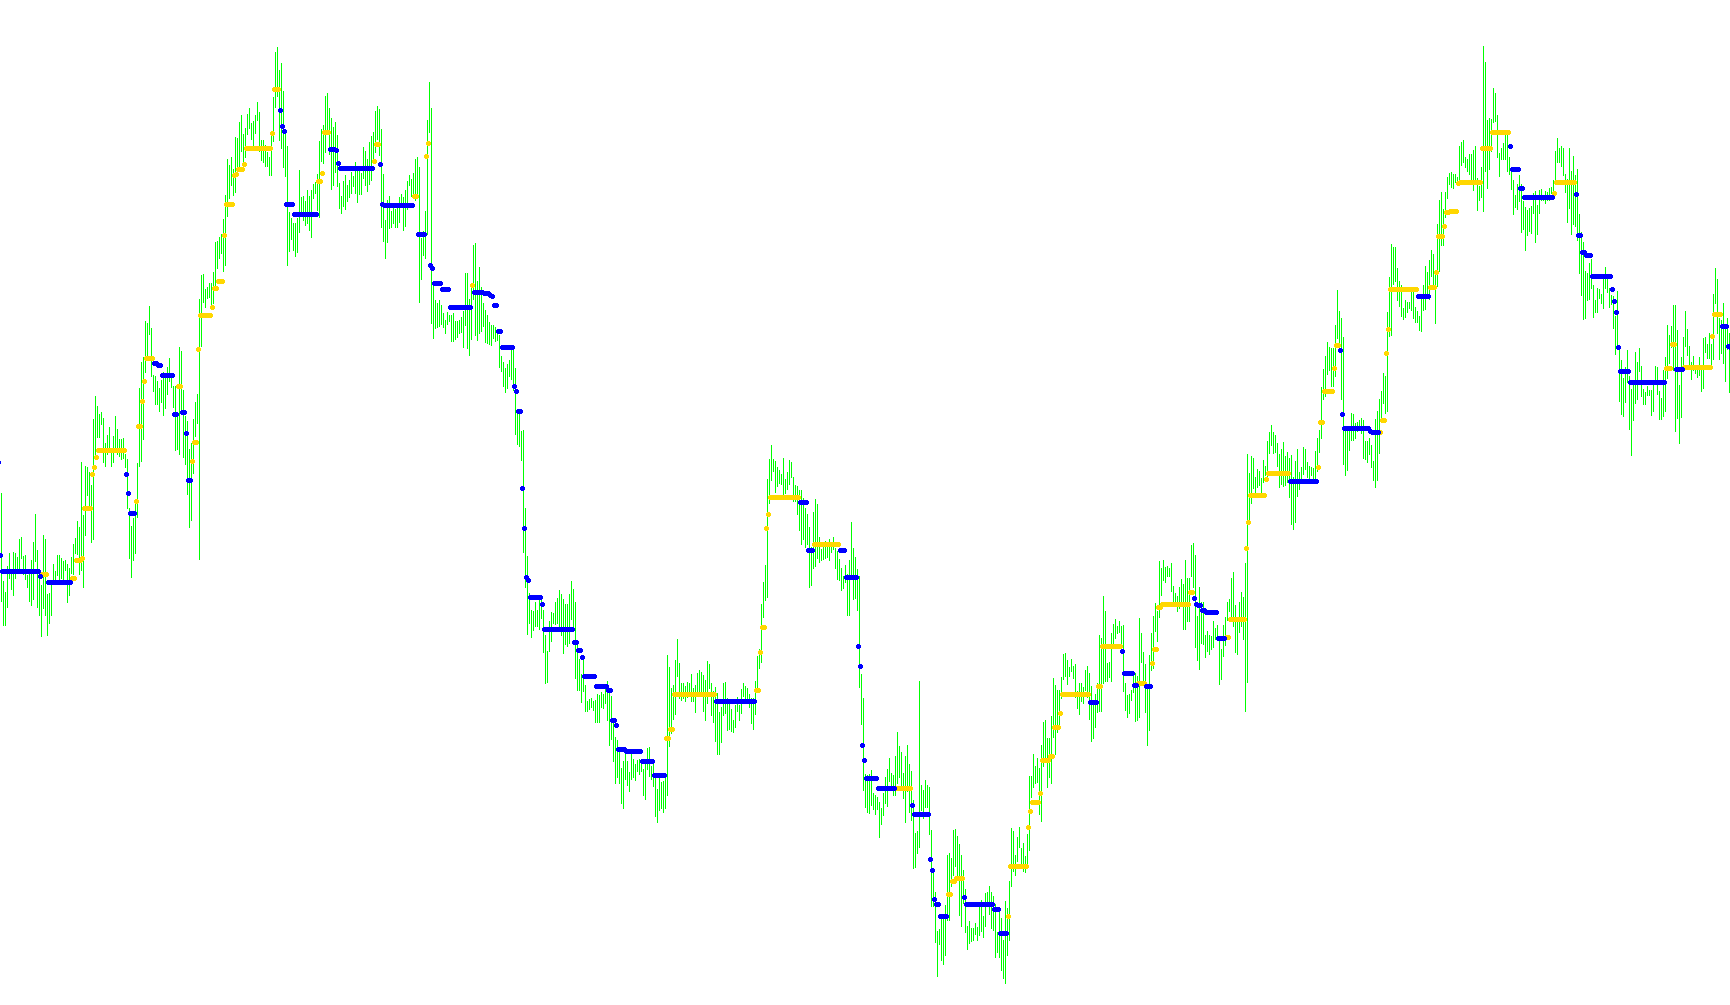
This script is designed to identify and visualize market trends by calculating a "stepping" movement rather than a smooth, flowing line. Instead of following every minor price fluctuation, it focuses on significant shifts in price direction, creating a cleaner visual representation of the market's path.
Core Logic Overview
The indicator operates based on three main stages: volatility calculation, trend identification, and "step" plotting.
1. Determining Market Volatility (The Step Size) Before determining where the price is going, the script first calculates how much the market typically moves. It looks back at a specific period of historical data (defined by the user) to measure the average range between the highs and lows. By analyzing this range, the script establishes a "Step Size"—a fixed amount of distance that the price must move to be considered a significant trend change.
2. Trend Identification The script constantly monitors the current price relative to its previous position. It uses the established Step Size to create a "buffer zone."
- If the price breaks above this buffer zone, the logic identifies an upward trend.
- If the price drops below this buffer zone, it identifies a downward trend.
Essentially, this prevents the indicator from "jittering" or changing direction due to minor noise; the price must move a substantial distance (based on historical volatility) before the trend is officially flipped.
3. Step Visualization Once a trend is identified, the script plots a visual marker on the chart.
- In an Uptrend, it places a point at the bottom of the current movement step.
- In a Downtrend, it places a point at the top of the current movement step.
The script is designed to "lock" onto these steps. When the trend is moving in one direction, it maintains that level until the price moves far enough in the opposite direction to cross the threshold. This results in a series of distinct "steps" that highlight the primary structure of the market while filtering out smaller, less significant price movements.
Key Features for the User
- Adaptive Movement: Because the "Step Size" is based on actual market history, the indicator automatically adjusts its sensitivity to different markets or timeframes (e.g., it will take larger steps in high-volatility markets and smaller steps in low-volatility markets).
- Visual Clarity: By using a stepping logic rather than a continuous line, it provides a more objective view of where the price "levels" are established.
- Customizable Sensitivity: Users can adjust the lookback period to change how much history the script uses to calculate volatility, as well as a multiplier to increase or decrease the size of the steps.
//+------------------------------------------------------------------+
//|                                              StepMA_Color_v2.mq4 |
//|                           Copyright © 2005, TrendLaboratory Ltd. |
//|                                       E-mail: igorad2004@list.ru |
//+------------------------------------------------------------------+
#property copyright "Copyright © 2005, TrendLaboratory Ltd."
#property link      "E-mail: igorad2004@list.ru"

#property indicator_chart_window
#property indicator_buffers 2
#property indicator_color1 Blue
#property indicator_color2 Red
//---- input parameters
extern int PeriodWATR=100;
extern double Kwatr=1.0000;
extern int Advance=0;
extern int HighLow=0;
//---- indicator buffers
double UpBuffer[];
double DownBuffer[];
//+------------------------------------------------------------------+
//| Custom indicator initialization function                         |
//+------------------------------------------------------------------+
  int init()
  {
   string short_name;
//---- indicator line
   SetIndexStyle(0,DRAW_ARROW);
   SetIndexStyle(1,DRAW_ARROW);
   SetIndexArrow(0,159);
   SetIndexArrow(1,159);
   SetIndexShift(0,Advance);
   SetIndexShift(1,Advance);
   SetIndexBuffer(0,UpBuffer);
   SetIndexBuffer(1,DownBuffer);
   IndicatorDigits(MarketInfo(Symbol(),MODE_DIGITS));
//---- name for DataWindow and indicator subwindow label
   short_name="StepMA("+PeriodWATR+")";
   IndicatorShortName(short_name);
   SetIndexLabel(0,"UpTrendStepMA");
   SetIndexLabel(1,"DownTrendStepMA");
//----
   SetIndexDrawBegin(0,PeriodWATR);
   SetIndexDrawBegin(1,PeriodWATR);
//----
   return(0);
  }

//+------------------------------------------------------------------+
//| StepMA_v2                                                         |
//+------------------------------------------------------------------+
int start()
  {
   int i,shift,trend;
   double smin0,smax0,smin1,smax1,AvgRange,dK,WATR;

   AvgRange=0;
	for (i=PeriodWATR-1;i>=0;i--)
	    {
       dK = 1+(PeriodWATR-i)/PeriodWATR;
       AvgRange=AvgRange+ dK*MathAbs(High[i]-Low[i]);
       }
	WATR = AvgRange/PeriodWATR;
	int StepSize=Kwatr*WATR/Point;
	Comment(" StepSize = ", StepSize);


   for(shift=Bars-1;shift>=0;shift--)
   {
	if (HighLow>0)
	  {
	  smax0=Low[shift]+2*StepSize*Point;
	  smin0=High[shift]-2*StepSize*Point;

	  if(Close[shift]>smax1) trend=1;
	  if(Close[shift]<smin1) trend=-1;
	  }

	if (HighLow == 0)
	  {
	  smax0=Close[shift]+2*StepSize*Point;
	  smin0=Close[shift]-2*StepSize*Point;

	  if (Close[shift]>smax1)  trend=1;
	  if (Close[shift]<smin1)  trend=-1;
	  }

	  if(trend>0 && smin0<smin1) smin0=smin1;
	  if(trend<0 && smax0>smax1) smax0=smax1;

	  if (trend>0)
	  {
	  UpBuffer[shift]=smin0+StepSize*Point;
	  DownBuffer[shift]=-1.0;
	  }
	  if (trend<0)
	  {
	  DownBuffer[shift]=smax0-StepSize*Point;
	  UpBuffer[shift]=-1.0;
	  }

	  smin1=smin0;
	  smax1=smax0;
	 }
	return(0);
 }
Comments