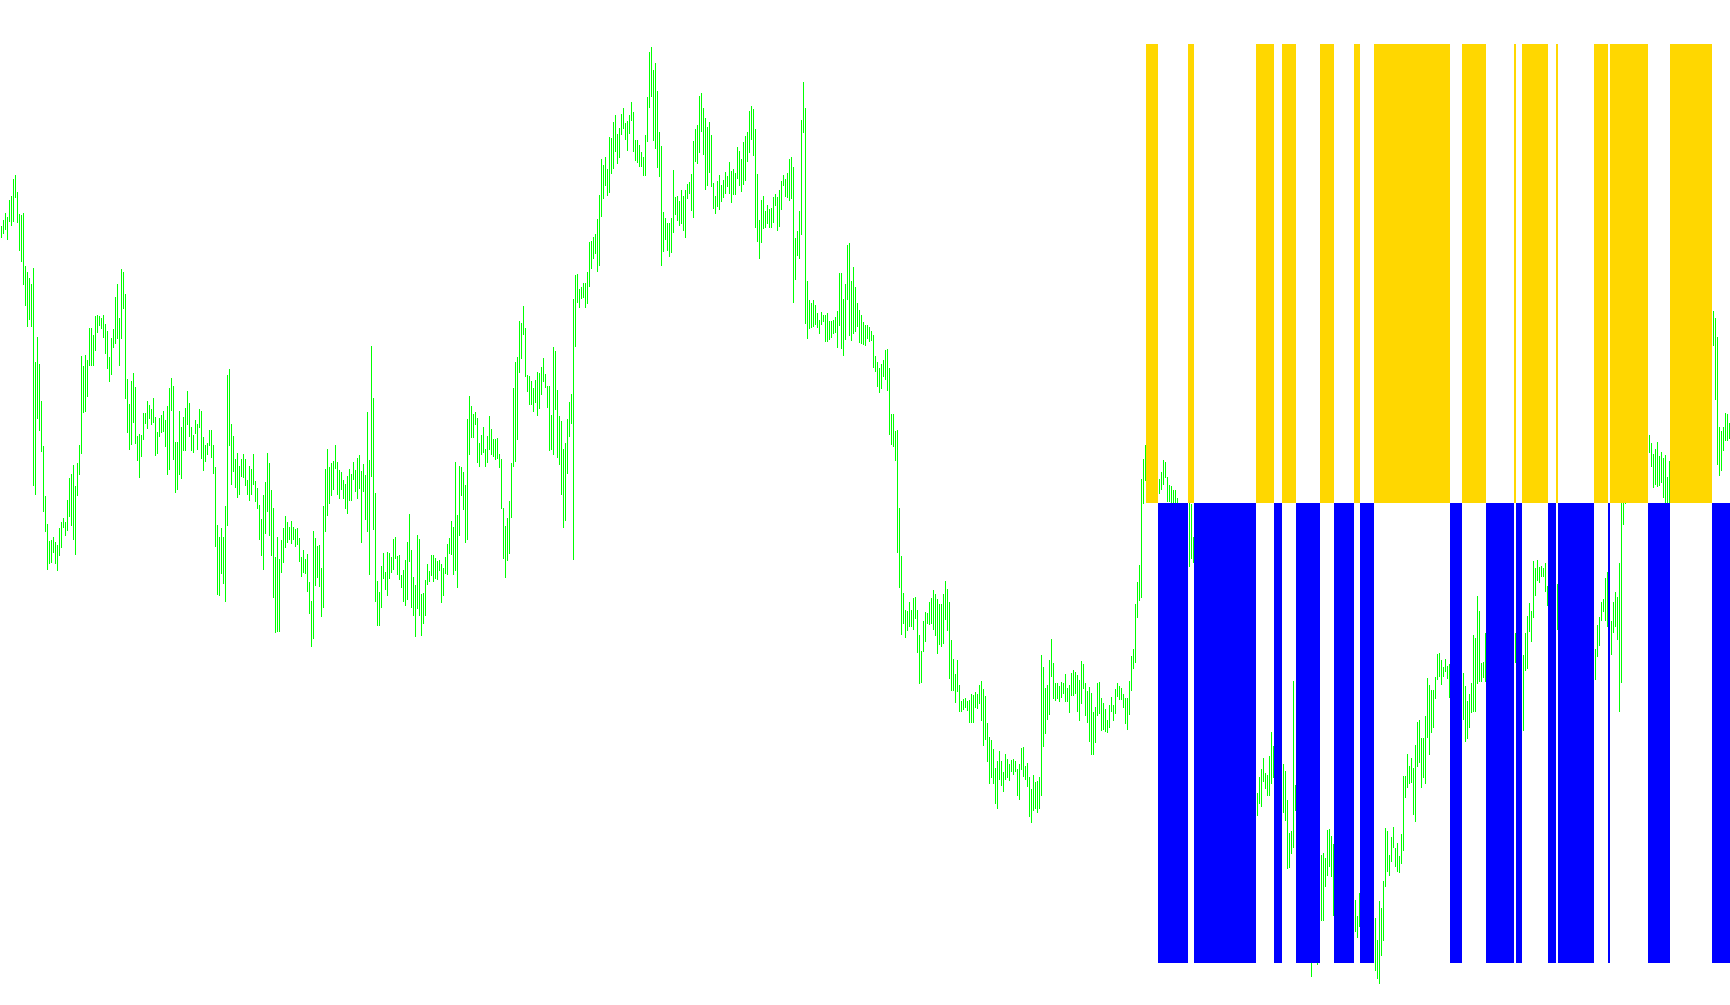
This tool is a visual trading indicator designed to help market participants identify the prevailing trend direction in price action. By analyzing historical price fluctuations, it translates complex movements into a simplified visual format, allowing for quicker decision-making on a trading chart.
Core Logic and Mechanism
The logic behind this script operates through three primary stages:
1. Price Range Identification The indicator focuses on a specific "look-back" period (the number of previous candles it examines). Within this window, the script identifies the highest price reached and the lowest price recorded. This establishes the boundaries of the recent market activity.
2. Dynamic Threshold Calculation Once the highest and lowest points are identified, the script calculates a specific percentage-based "drop" or "buffer." Instead of looking at the entire range between the high and low, it calculates a specific level based on a user-defined maximum percentage. This creates a dynamic ceiling that follows the market's movement.
3. Trend Visualization The final step is where the data becomes visible to the trader. The script compares these calculated levels against each other to determine momentum:
- Bullish Sentiment: If the price dynamics suggest an upward trend based on the calculated threshold, the indicator displays a specific visual signal (represented in Lime/Aqua).
- Bearish Sentiment: If the data suggests downward pressure or a break below the threshold, it shifts the visual signal to a different color (Red).
How it Benefits the User
Because the script handles all the heavy lifting of identifying high/low points and calculating percentage offsets in real-time, it removes the guesswork from trend detection. Instead of manually guessing if the market is moving up or down, the user can rely on the clear, color-coded histogram. When the colors shift, it signals a potential change in market sentiment, helping traders stay aligned with the dominant flow of the market.
/*-----------------------------+
|			       |
| Shared by www.Aptrafx.com    |
|			       |
+------------------------------*/

//+------------------------------------------------------------------+
//|                                                 SilverTrend .mq4 |
//|                             SilverTrend  rewritten by CrazyChart |
//|                                                 http://viac.ru/  |
//|                  modified by Kalenzo bartlomiej.gorski@gmail.com |
//|                  modified yet again by monkey nuts (Lowphat)     |
//+------------------------------------------------------------------+
#property copyright "SilverTrend  rewritten by CrazyChart"
#property link      "http://viac.ru/ "

#property indicator_separate_window
#property indicator_buffers 2
#property indicator_color1 Lime
#property indicator_color2 Red

extern int       SSP=7;
extern double    Kmax=50.6;

extern int       CountBars=300;

//---- buffers
double ExtMapBuffer1[];
double ExtMapBuffer2[];
double ExtHBuffer1[];
double ExtHBuffer2[];


//+------------------------------------------------------------------+
//| Custom indicator initialization function                         |
//+------------------------------------------------------------------+
int init()
  {
//---- indicators
   IndicatorBuffers(4);
   SetIndexStyle(0,DRAW_HISTOGRAM,0,2);  //Red
   SetIndexBuffer(0,ExtHBuffer1);
   SetIndexStyle(1,DRAW_HISTOGRAM,0,2);  //Aqua
   SetIndexBuffer(1,ExtHBuffer2);

   SetIndexBuffer(2,ExtMapBuffer1);
   SetIndexBuffer(3,ExtMapBuffer2);

   IndicatorShortName("FxTrend ("+SSP+")");

//----
   return(0);
  }
//+------------------------------------------------------------------+
//| Custor indicator deinitialization function                       |
//+------------------------------------------------------------------+
int deinit()
  {

   return(0);
  }
//+------------------------------------------------------------------+
//| Custom indicator iteration function                              |
//+------------------------------------------------------------------+
int start()
  {

  if (CountBars>=Bars) CountBars=Bars;

   SetIndexDrawBegin(0,Bars-CountBars+SSP);
   SetIndexDrawBegin(1,Bars-CountBars+SSP);

  int i, counted_bars=IndicatorCounted();
  double SsMax, SsMin, smin, smax;

  if(Bars<=SSP+1) return(0);

if(counted_bars<SSP+1)
   {
      for(i=1;i<=SSP;i++) ExtMapBuffer1[CountBars-i]=0.0;
      for(i=1;i<=SSP;i++) ExtMapBuffer2[CountBars-i]=0.0;
   }

for(i=CountBars-SSP;i>=0;i--) {


  SsMax = High[Highest(NULL,0,MODE_HIGH,SSP,i-SSP+1)];
  SsMin = Low[Lowest(NULL,0,MODE_LOW,SSP,i-SSP+1)];


   smax = SsMax-(SsMax-SsMin)*Kmax/100;

   ExtMapBuffer1[i-SSP+6]=smax;
   ExtMapBuffer2[i-SSP-1]=smax;

}
   for(int b=CountBars-SSP;b>=0;b--)
   {

      if(ExtMapBuffer1[b]>ExtMapBuffer2[b])
      {
         ExtHBuffer1[b]=1;
         ExtHBuffer2[b]=0;
      }
      else
      {
         ExtHBuffer1[b]=0;
         ExtHBuffer2[b]=-1;
      }

   }

return(0);
}
Comments