ForexTrend_v2
Download script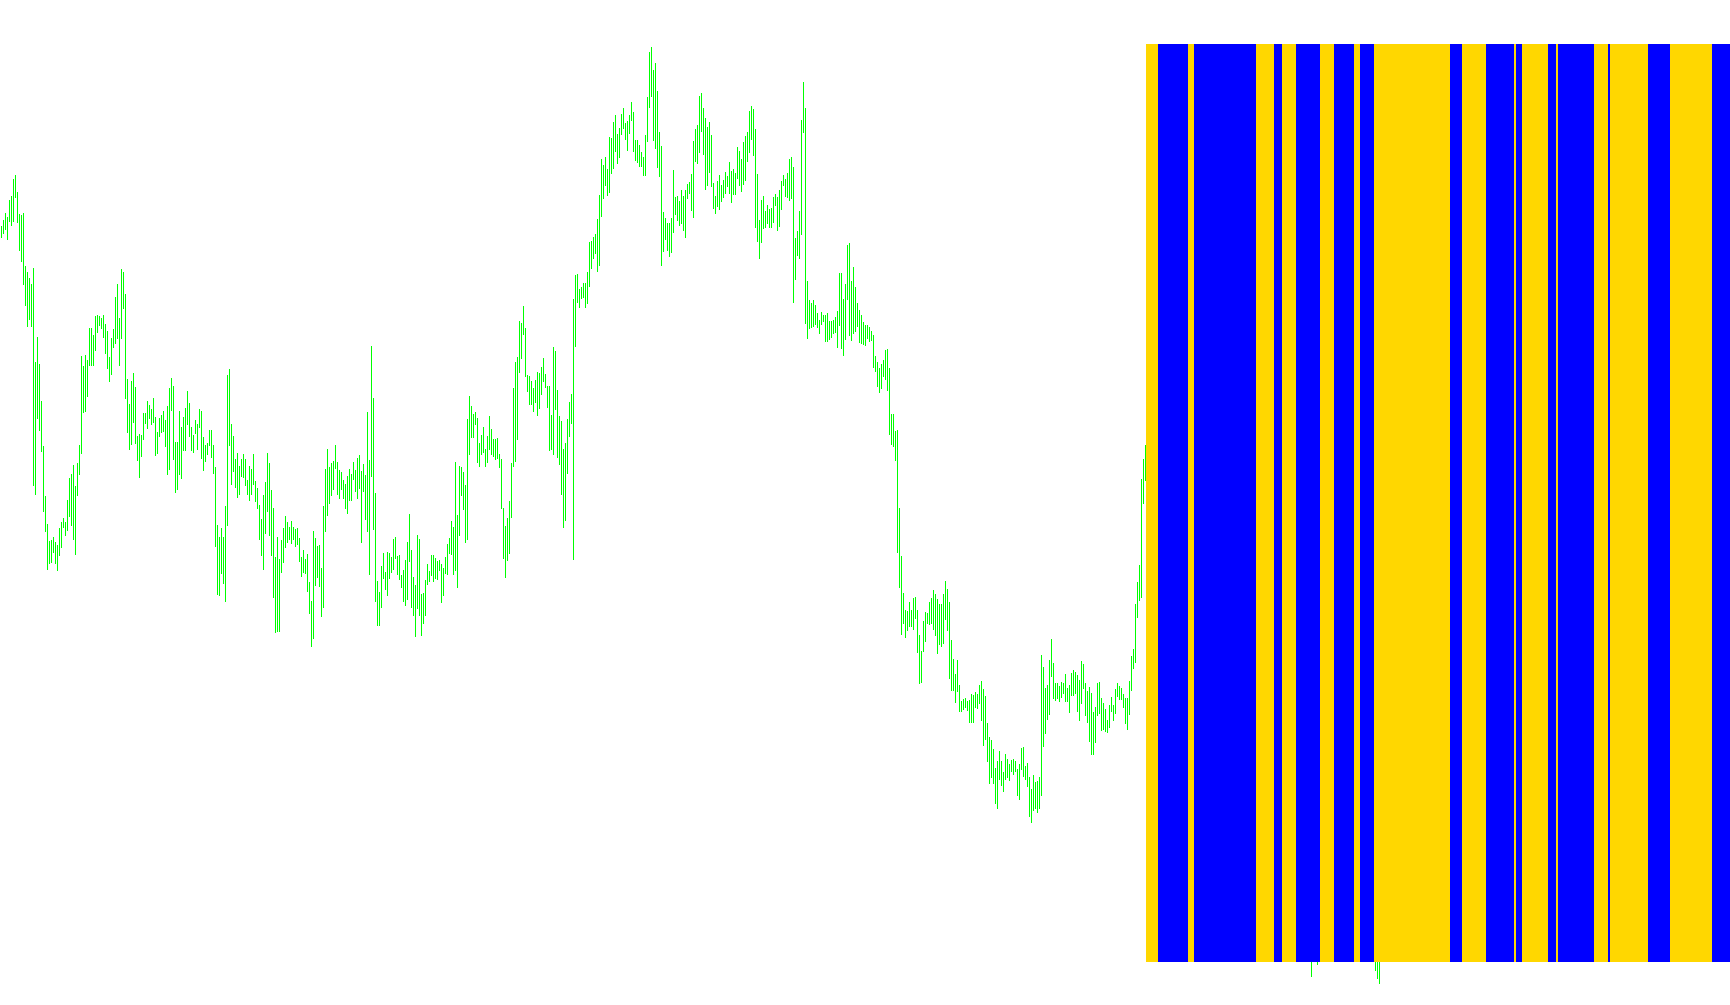
The SilverTrend indicator is designed to provide traders with a visual representation of market momentum and trend direction by analyzing price extremes over a specific period. Instead of looking at every tiny fluctuation in price, this tool focuses on identifying significant highs and lows to determine the overall "flow" of the market.
Core Mechanics
The logic operates through three primary steps:
1. Identifying Price Boundaries
The indicator looks back at a user-defined number of candles (controlled by the SSP setting) to find the highest peak and the lowest valley reached during that timeframe. By identifying these boundaries, the script establishes the current "trading range."
2. Calculating the Trend Threshold
Once the highest high and lowest low are found, the script calculates a dynamic threshold. It uses a percentage-based calculation (defined by the Kmax value) to determine a specific price level relative to that range. Essentially, it creates a "buffer zone" that helps filter out minor market noise, ensuring that only significant movements trigger a change in the visual signal.
3. Generating Visual Signals The indicator compares these calculated values against each other to decide which direction the trend is leaning. This comparison results in a binary output—meaning it chooses between two states:
- Bullish Signal: When the price action suggests upward momentum, the indicator highlights this with one color (DeepSkyBlue).
- Bearish Signal: When the price action suggests downward momentum, it switches to another color (Red).
Visual Representation
Rather than appearing directly on the main price chart, this tool is displayed in a separate window at the bottom of your trading platform. It appears as a histogram of colored bars. These bars act as a quick reference guide: when the colors switch, it alerts the user to a potential shift in market sentiment, allowing for a clearer understanding of whether the current environment is favoring buyers or sellers.
//+------------------------------------------------------------------+
//|                                                 SilverTrend .mq4 |
//|                             SilverTrend  rewritten by CrazyChart |
//|                                                 http://viac.ru/  |
//|                  modified by Kalenzo bartlomiej.gorski@gmail.com |
//+------------------------------------------------------------------+
#property copyright "SilverTrend  rewritten by CrazyChart"
#property link      "http://viac.ru/ "

#property indicator_separate_window
#property indicator_buffers 2
#property indicator_color1 DeepSkyBlue  //Red  //Aqua
#property indicator_color2 Red

extern int       SSP=7;
extern double    Kmax=50.6; //24 21.6 21.6
extern int       CountBars=300;

//---- buffers
double ExtMapBuffer1[];
double ExtMapBuffer2[];
double ExtHBuffer1[];
double ExtHBuffer2[];


//+------------------------------------------------------------------+
//| Custom indicator initialization function                         |
//+------------------------------------------------------------------+
int init()
  {
//---- indicators
   IndicatorBuffers(4);
   SetIndexStyle(0,DRAW_HISTOGRAM,0,2);  //Red
   SetIndexBuffer(0,ExtHBuffer1);
   SetIndexStyle(1,DRAW_HISTOGRAM,0,2);  //Aqua
   SetIndexBuffer(1,ExtHBuffer2);

   SetIndexBuffer(2,ExtMapBuffer1);
   SetIndexBuffer(3,ExtMapBuffer2);

   IndicatorShortName("FxTrend v2("+SSP+")");

//----
   return(0);
  }
//+------------------------------------------------------------------+
//| Custor indicator deinitialization function                       |
//+------------------------------------------------------------------+
int deinit()
  {

   return(0);
  }
//+------------------------------------------------------------------+
//| Custom indicator iteration function                              |
//+------------------------------------------------------------------+
int start()
  {

  if (CountBars>=Bars) CountBars=Bars;

   SetIndexDrawBegin(0,Bars-CountBars+SSP);
   SetIndexDrawBegin(1,Bars-CountBars+SSP);

  int i, counted_bars=IndicatorCounted();
  double SsMax, SsMin, smin, smax;

  if(Bars<=SSP+1) return(0);

if(counted_bars<SSP+1)
   {
      for(i=1;i<=SSP;i++) ExtMapBuffer1[CountBars-i]=0.0;
      for(i=1;i<=SSP;i++) ExtMapBuffer2[CountBars-i]=0.0;
   }

for(i=CountBars-SSP;i>=0;i--) {


  SsMax = High[Highest(NULL,0,MODE_HIGH,SSP,i-SSP+1)];
  SsMin = Low[Lowest(NULL,0,MODE_LOW,SSP,i-SSP+1)];

   smax = SsMax-(SsMax-SsMin)*Kmax/100;

   ExtMapBuffer1[i-SSP+6]=smax;
   ExtMapBuffer2[i-SSP-1]=smax;

}
   for(int b=CountBars-SSP;b>=0;b--)
   {
      if(ExtMapBuffer1[b]>ExtMapBuffer2[b])
      {
         ExtHBuffer1[b]=1;
         ExtHBuffer2[b]=0;
      }
      else
      {
         ExtHBuffer1[b]=0;
         ExtHBuffer2[b]=1;
      }

   }

return(0);
}
Comments