ForexTrend Histo
Download script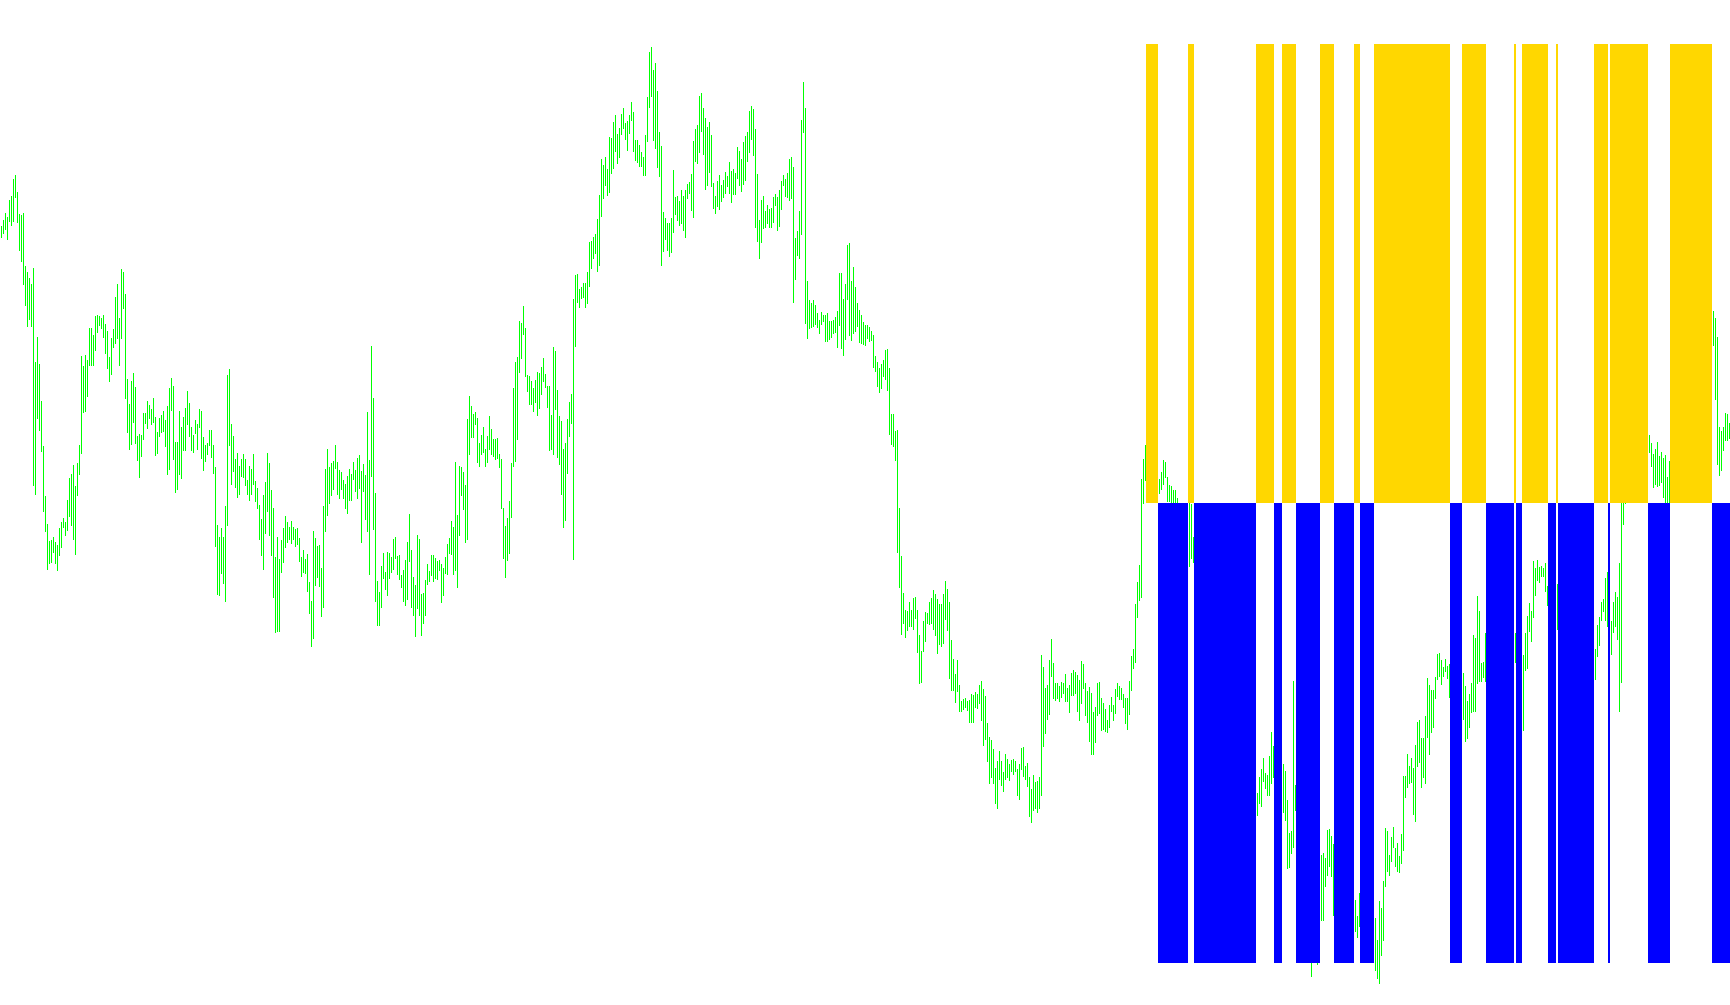
The SilverTrend indicator is designed to provide a visual representation of market momentum and trend direction by analyzing historical price extremes. Instead of simply looking at the current price, it evaluates specific "windows" of time to determine where the price sits in relation to recent highs and lows.
How the Logic Works
1. Identifying Price Extremes The tool starts by scanning a defined number of previous candles (based on the "SSP" setting). During this scan, it identifies two key data points: the highest peak reached and the lowest valley touched within that period. These values represent the boundaries of the recent market range.
2. Calculating the Trend Threshold Once the highest and lowest points are found, the script calculates a specific price level. It takes the difference between the high and the low to determine the total "range." It then applies a percentage-based reduction (controlled by the "Kmax" setting) to the peak. This creates a dynamic threshold or a "ceiling" that moves with the market.
3. Determining Directional Flow The indicator then compares two different instances of this calculated threshold. By looking at how these thresholds interact with one another over time, the logic can determine the underlying direction of the price movement:
- If the primary threshold is higher than the secondary threshold, it suggests upward pressure.
- If the primary threshold falls below the secondary, it indicates downward pressure.
4. Visual Output The final result is displayed in a separate window as a histogram. This translates complex mathematical calculations into simple visual cues:
- Positive Movement: When the logic detects an upward trend, the indicator displays a specific color (Lime/Aqua) to signal bullish momentum.
- Negative Movement: When the logic detects a downward trend, the indicator switches colors (Red) to signal bearish momentum.
In summary, the script filters out "market noise" by focusing on significant price boundaries and uses the relationship between those boundaries to give traders a clear, visual map of the current market trend.
//+------------------------------------------------------------------+
//|                                                 SilverTrend .mq4 |
//|                             SilverTrend  rewritten by CrazyChart |
//|                                                 http://viac.ru/  |
//|                  modified by Kalenzo bartlomiej.gorski@gmail.com |
//|                  modified yet again by monkey nuts (Lowphat)     |
//+------------------------------------------------------------------+
#property copyright "SilverTrend  rewritten by CrazyChart"
#property link      "http://viac.ru/ "

#property indicator_separate_window
#property indicator_buffers 2
#property indicator_color1 Lime
#property indicator_color2 Red

extern int       SSP=7;
extern double    Kmax=50.6;

extern int       CountBars=300;

//---- buffers
double ExtMapBuffer1[];
double ExtMapBuffer2[];
double ExtHBuffer1[];
double ExtHBuffer2[];


//+------------------------------------------------------------------+
//| Custom indicator initialization function                         |
//+------------------------------------------------------------------+
int init()
  {
//---- indicators
   IndicatorBuffers(4);
   SetIndexStyle(0,DRAW_HISTOGRAM,0,2);  //Red
   SetIndexBuffer(0,ExtHBuffer1);
   SetIndexStyle(1,DRAW_HISTOGRAM,0,2);  //Aqua
   SetIndexBuffer(1,ExtHBuffer2);

   SetIndexBuffer(2,ExtMapBuffer1);
   SetIndexBuffer(3,ExtMapBuffer2);

   IndicatorShortName("FxTrend ("+SSP+")");

//----
   return(0);
  }
//+------------------------------------------------------------------+
//| Custor indicator deinitialization function                       |
//+------------------------------------------------------------------+
int deinit()
  {

   return(0);
  }
//+------------------------------------------------------------------+
//| Custom indicator iteration function                              |
//+------------------------------------------------------------------+
int start()
  {

  if (CountBars>=Bars) CountBars=Bars;

   SetIndexDrawBegin(0,Bars-CountBars+SSP);
   SetIndexDrawBegin(1,Bars-CountBars+SSP);

  int i, counted_bars=IndicatorCounted();
  double SsMax, SsMin, smin, smax;

  if(Bars<=SSP+1) return(0);

if(counted_bars<SSP+1)
   {
      for(i=1;i<=SSP;i++) ExtMapBuffer1[CountBars-i]=0.0;
      for(i=1;i<=SSP;i++) ExtMapBuffer2[CountBars-i]=0.0;
   }

for(i=CountBars-SSP;i>=0;i--) {


  SsMax = High[Highest(NULL,0,MODE_HIGH,SSP,i-SSP+1)];
  SsMin = Low[Lowest(NULL,0,MODE_LOW,SSP,i-SSP+1)];


   smax = SsMax-(SsMax-SsMin)*Kmax/100;

   ExtMapBuffer1[i-SSP+6]=smax;
   ExtMapBuffer2[i-SSP-1]=smax;

}
   for(int b=CountBars-SSP;b>=0;b--)
   {

      if(ExtMapBuffer1[b]>ExtMapBuffer2[b])
      {
         ExtHBuffer1[b]=1;
         ExtHBuffer2[b]=0;
      }
      else
      {
         ExtHBuffer1[b]=0;
         ExtHBuffer2[b]=-1;
      }

   }

return(0);
}
Comments