ForexOFFTrend1_v2
Download script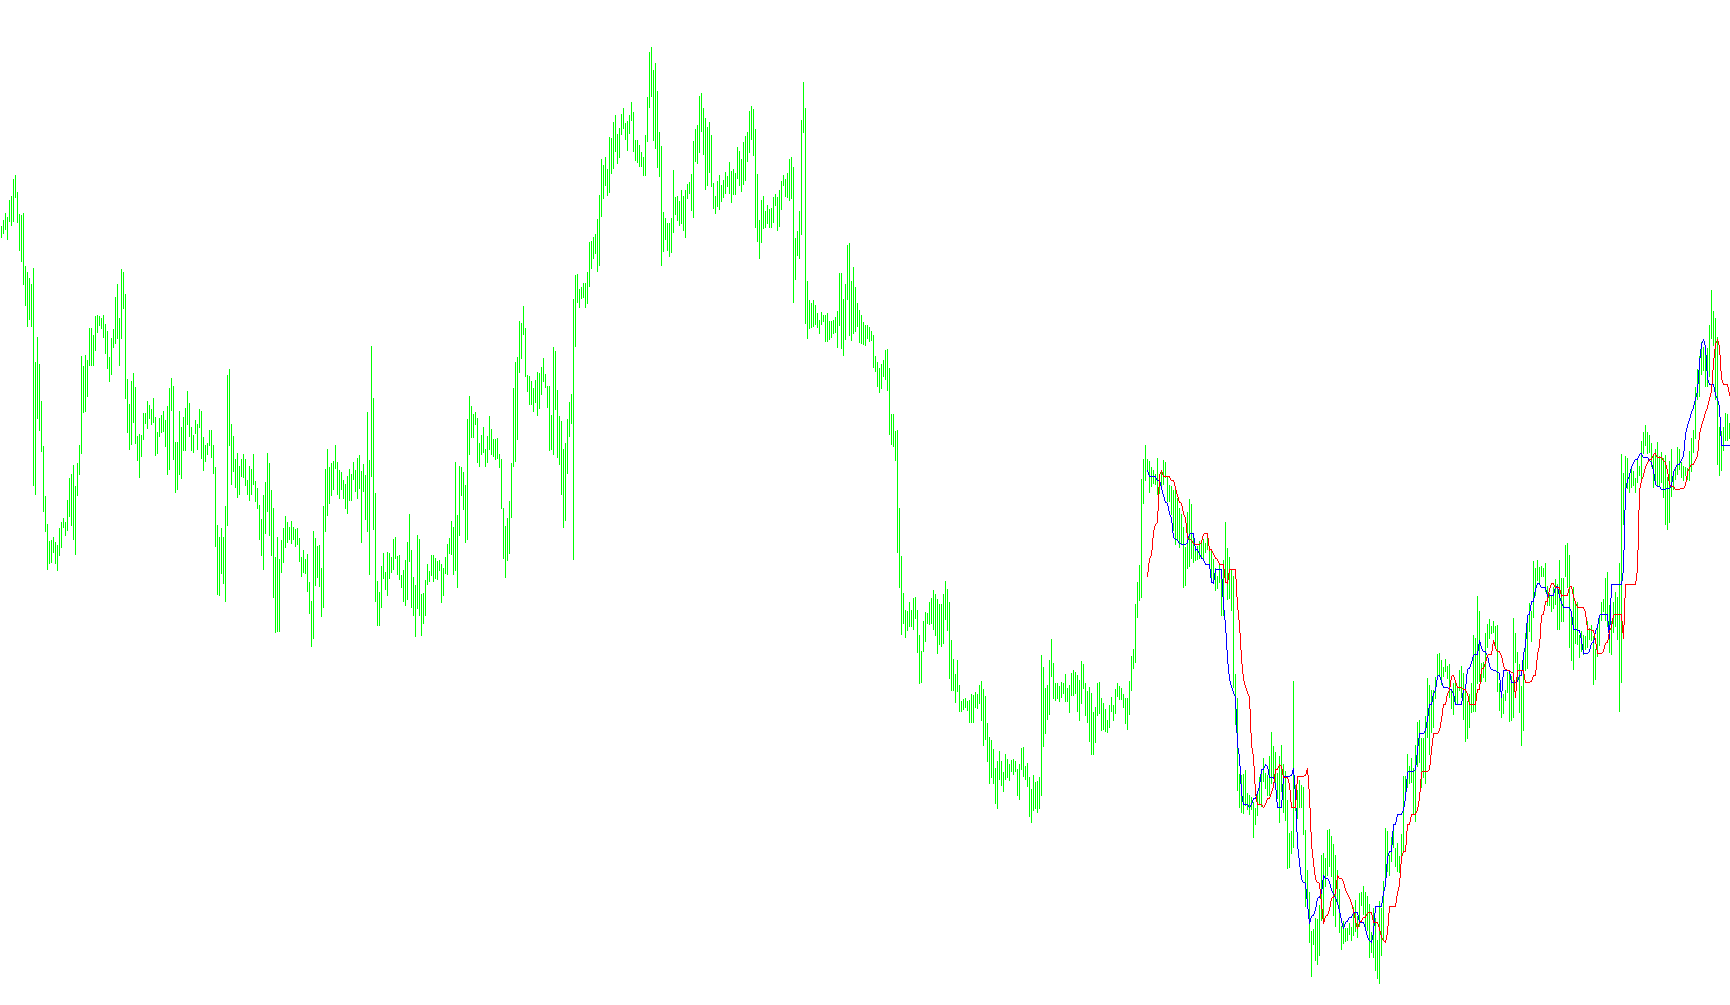
The SilverTrend tool is designed to provide visual guidance for traders by identifying potential market directions based on price action. Instead of relying on standard momentum oscillators, it focuses on the relationship between historical price extremes and calculated volatility levels.
Core Logic and Methodology
The script operates by analyzing a specific window of recent price history (defined by the user) to establish a "zone" of market activity. Its logic can be broken down into three main stages:
1. Identifying Price Extremes For every point on the chart, the tool looks back at a set number of candles to find the highest high and the lowest low reached during that period. This establishes the immediate range in which the price is currently moving.
2. Calculating Dynamic Thresholds Once the high and low points are identified, the script calculates two distinct mathematical boundaries based on the distance between those highs and lows:
- The Upper Boundary: Calculated using a maximum percentage variance.
- The Lower Boundary: Calculated using a minimum percentage variance.
Essentially, the tool is trying to determine where "overextended" price action might sit relative to the recent trend.
3. Trend Visualization and Signaling The tool plots these calculations as two distinct lines on your chart (one Blue and one Red). By comparing the position of these lines in real-time, the script generates a signal:
- Buy Signal: When the current primary calculation trends upward or exceeds specific thresholds relative to its previous state.
- Sell Signal: When the calculation trends downward or falls below those thresholds.
How it behaves on your chart
The indicator provides a continuous visual flow rather than isolated arrows. It smooths out market noise by looking at the "Highest" and "Lowest" peaks over a rolling period, which helps filter out minor price fluctuations. The final output is a clear textual comment on the screen that updates dynamically to tell you whether the current trend bias is towards a "BUY" or a "SELL" based on where those calculated boundaries sit in relation to one another.
//+------------------------------------------------------------------+
//|                                                 SilverTrend .mq4 |
//|                             SilverTrend  rewritten by CrazyChart |
//|                                                 http://viac.ru/  |
//+------------------------------------------------------------------+
#property copyright "SilverTrend  rewritten by CrazyChart"
#property link      "http://viac.ru/ "

#property indicator_chart_window
#property indicator_buffers 2
#property indicator_color1 Blue
#property indicator_color2 Red

//---- input parameters
extern int       CountBars=300;
extern int       SSP=7;
extern double    Kmin=1.6;
extern double    Kmax=50.6; //24 21.6 21.6

//---- buffers
double ExtMapBuffer1[];
double ExtMapBuffer2[];


//+------------------------------------------------------------------+
//| Custom indicator initialization function                         |
//+------------------------------------------------------------------+
int init()
  {
   IndicatorBuffers(2);

   SetIndexStyle(0,DRAW_LINE,0,1,Blue);
   SetIndexBuffer(0,ExtMapBuffer1);

   SetIndexStyle(1,DRAW_LINE,0,1,Red);
   SetIndexBuffer(1,ExtMapBuffer2);

   return(0);
  }


//+------------------------------------------------------------------+
//| Custor indicator deinitialization function                       |
//+------------------------------------------------------------------+
int deinit()
  {
   return(0);
  }


//+------------------------------------------------------------------+
//| Custom indicator iteration function                              |
//+------------------------------------------------------------------+
int start()
  {
   if (CountBars>=Bars) CountBars=Bars;

   SetIndexDrawBegin(0,Bars-CountBars+SSP);
   SetIndexDrawBegin(1,Bars-CountBars+SSP);

   int i, i2,loopbegin,counted_bars=IndicatorCounted();
   double SsMax, SsMin, K, val1, val2, smin, smax, price;

   if(Bars<=SSP+1) return(0);

//K=33-RISK;

/*
if (firstTime==true)   {
   loopbegin = CountBars;
   if (loopbegin>(Bars-2*SSP+1)) loopbegin=Bars-2*SSP+1;
   firstTime=False;
}; ðóäèìåíò ñòàðîé ïðîãðàììû
*/

//+++++++-SSP
   if(counted_bars<SSP+1)
     {
      for(i=1;i<=SSP;i++) ExtMapBuffer1[CountBars-i]=0.0;
      for(i=1;i<=SSP;i++) ExtMapBuffer2[CountBars-i]=0.0;
     }
//+++++++-SSP


   for(i=CountBars-SSP;i>=0;i--)
     {
      SsMax = High[Highest(NULL,0,MODE_HIGH,SSP,i-SSP+1)];
      SsMin = Low[Lowest(NULL,0,MODE_LOW,SSP,i-SSP+1)];
      smin = SsMin-(SsMax-SsMin)*Kmin/100;
      smax = SsMax-(SsMax-SsMin)*Kmax/100;
      ExtMapBuffer1[i-SSP+6]=smax;
      ExtMapBuffer2[i-SSP-1]=smax;
      val1 = ExtMapBuffer1[0];
      val2 = ExtMapBuffer2[0];
      if (val1 > val2) Comment("BUY  ",val1);
      if (val1 < val2) Comment("SELL ",val2);
     }
   return(0);
  }
Comments