ForexOFFTrend1
Download script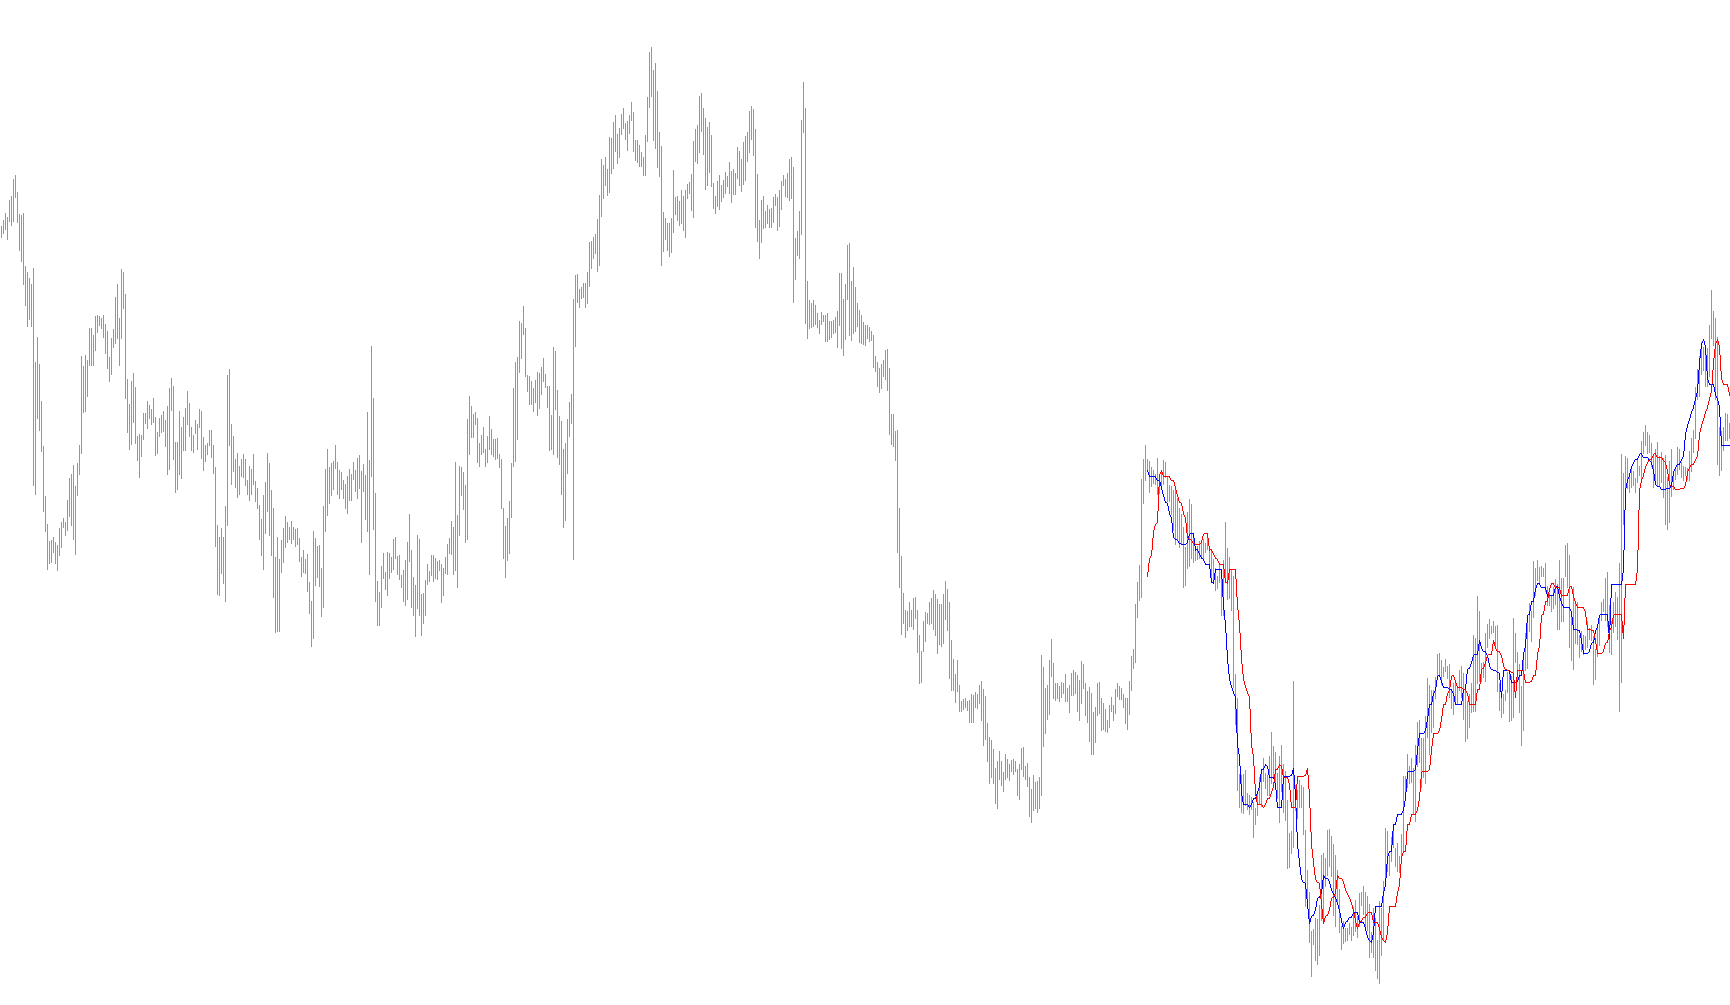
The SilverTrend indicator is designed to help traders visualize price momentum and potential reversal zones by identifying specific high and low boundaries over a set period of time. Rather than just following the price, it calculates "support" and "resistance" levels based on historical price extremes to provide a clearer picture of market structure.
How the Logic Works
1. Data Collection (The Lookback Period)
The script analyzes a specific number of previous candles (defined by the user as CountBars). By looking at this window of history, the tool establishes a context for what the "recent" price action looks like, ensuring that the calculations are relevant to current market conditions.
2. Identifying Extremes
For every point on the chart, the logic scans backward to find the highest peak (SsMax) and the lowest valley (SsMin) within a rolling window (defined by SSP). This helps the indicator understand the boundaries of the current price "swing."
3. Calculating Dynamic Levels Instead of simply plotting the absolute high or low, the script applies a mathematical percentage calculation to these extremes:
- It determines the distance between the highest and lowest points.
- It then calculates two specific levels based on user-defined percentages (
KminandKmax). - These percentages essentially "shade" the area of interest, creating specific price targets or boundaries.
4. Visual Output and Signal Logic The script processes these calculations to draw two distinct lines on your chart:
- Blue Line: Represents one calculated boundary of the price movement.
- Red Line: Represents the opposing boundary.
5. Real-Time Feedback To make the data actionable for a human trader, the script includes a dynamic comment feature. It compares the current positions of these two lines:
- If the primary value is higher than the secondary value, the script provides a "buy" hint on the chart display.
- If the primary value is lower than the secondary value, it provides a "sell" hint.
Summary for the User
In plain terms, this tool acts as a sophisticated "boundary tracker." It looks at recent price history to find out how high and low the market has swung, then calculates specific levels where the trend might be shifting. By comparing these two calculated lines, it highlights whether the current momentum leans toward an upward (buy) or downward (sell) direction based on historical volatility.
//+------------------------------------------------------------------+
//|                                                 SilverTrend .mq4 |
//|                             SilverTrend  rewritten by CrazyChart |
//|                                                 http://viac.ru/  |
//+------------------------------------------------------------------+
#property copyright "SilverTrend  rewritten by CrazyChart"
#property link      "http://viac.ru/ "

#property indicator_chart_window
#property indicator_buffers 2
#property indicator_color1 Blue
#property indicator_color2 Red
//---- input parameters

extern int       CountBars=300;
extern int       SSP=7;
extern double    Kmin=1.6;
extern double    Kmax=50.6; //24 21.6 21.6


//---- buffers
double ExtMapBuffer1[];
double ExtMapBuffer2[];
//+------------------------------------------------------------------+
//| Custom indicator initialization function                         |
//+------------------------------------------------------------------+
int init()
  {
//---- indicators
   IndicatorBuffers(2);
   SetIndexStyle(0,DRAW_LINE,0,1,Blue);
   SetIndexBuffer(0,ExtMapBuffer1);
   SetIndexStyle(1,DRAW_LINE,0,1,Red);
   SetIndexBuffer(1,ExtMapBuffer2);


//----
   return(0);
  }
//+------------------------------------------------------------------+
//| Custor indicator deinitialization function                       |
//+------------------------------------------------------------------+
int deinit()
  {

   return(0);
  }
//+------------------------------------------------------------------+
//| Custom indicator iteration function                              |
//+------------------------------------------------------------------+
int start()
  {

  if (CountBars>=Bars) CountBars=Bars;
   SetIndexDrawBegin(0,Bars-CountBars+SSP);
   SetIndexDrawBegin(1,Bars-CountBars+SSP);
  int i, i2,loopbegin,counted_bars=IndicatorCounted();
  double SsMax, SsMin, K, val1, val2, smin, smax, price;

  if(Bars<=SSP+1) return(0);
  //---- initial zero

//K=33-RISK;

/*
if (firstTime==true)   {
   loopbegin = CountBars;
   if (loopbegin>(Bars-2*SSP+1)) loopbegin=Bars-2*SSP+1;
   firstTime=False;
}; ðóäèìåíò ñòàðîé ïðîãðàììû
*/
  if(Bars<=SSP+1) return(0);
//---- initial zero

//+++++++
if(counted_bars<SSP+1)
   {
      for(i=1;i<=SSP;i++) ExtMapBuffer1[CountBars-i]=0.0;
      for(i=1;i<=SSP;i++) ExtMapBuffer2[CountBars-i]=0.0;
   }
//+++++++-SSP


for(i=CountBars-SSP;i>=0;i--) {


  SsMax = High[Highest(NULL,0,MODE_HIGH,SSP,i-SSP+1)];
  SsMin = Low[Lowest(NULL,0,MODE_LOW,SSP,i-SSP+1)];
   smin = SsMin-(SsMax-SsMin)*Kmin/100;
   smax = SsMax-(SsMax-SsMin)*Kmax/100;
   ExtMapBuffer1[i-SSP+6]=smax;
   ExtMapBuffer2[i-SSP-1]=smax;
   val1 = ExtMapBuffer1[0];
   val2 = ExtMapBuffer2[0];
if (val1 > val2) Comment("ïîêóïêà buy ",val1);

if (val1 < val2) Comment("ïðîäàæà sell ",val2);


}


//----
   return(0);
  }
//+------------------------------------------------------------------+
Comments