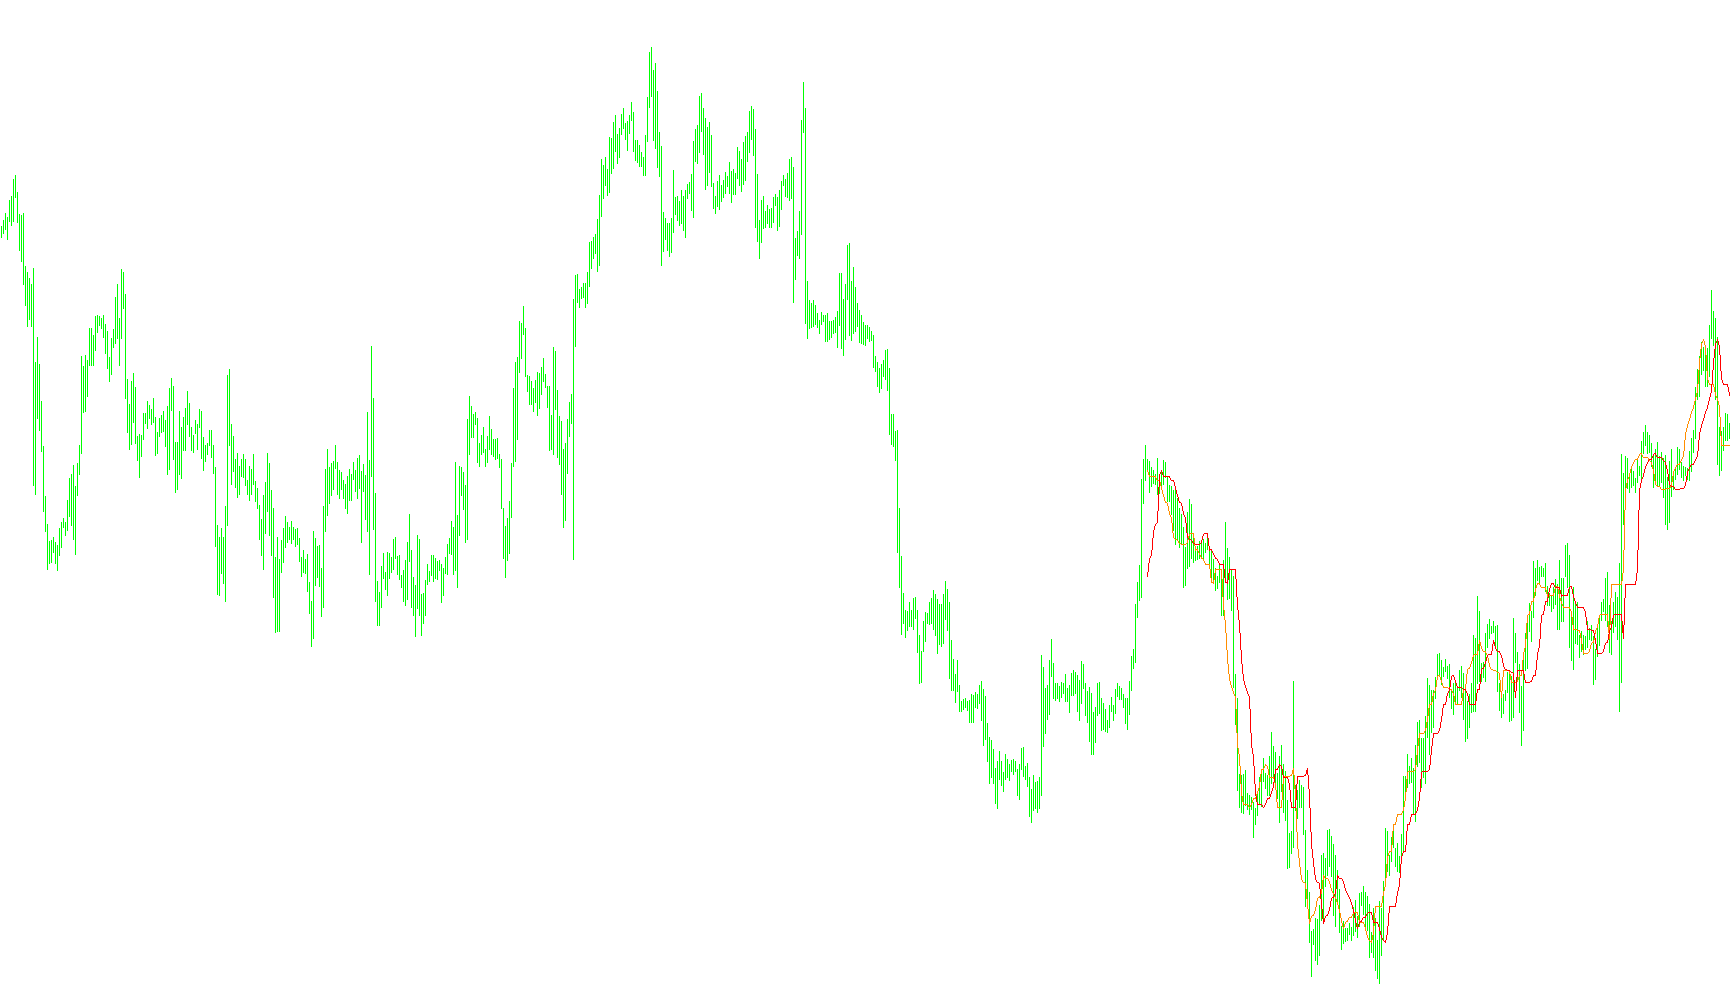
The SilverTrend script is a specialized technical analysis tool designed to identify and visualize market trends on a trading chart. Its primary purpose is to help traders distinguish between upward and downward price movements by calculating specific price boundaries based on historical volatility.
Core Logic and Functionality
The script operates by scanning the most recent price history to determine "support" and "resistance" levels. It works through the following logical steps:
1. Historical Data Analysis The tool looks back at a specific number of candles (defined by the user) to identify the highest high and the lowest low within that timeframe. This provides the script with a clear picture of the recent price range, allowing it to understand the "boundaries" of the current market movement.
2. Dynamic Boundary Calculation Instead of using static numbers, the script calculates two distinct price points based on the range between the highs and lows:
- It identifies a maximum threshold based on a percentage of the total price range.
- By calculating these boundaries, the tool attempts to filter out "noise" (minor price fluctuations) to focus on the broader trend.
3. Trend Identification (Buy vs. Sell Signals) The script creates two visual lines on your chart. The logic compares the values of these two lines in real-time:
- Bullish Sentiment: If the primary value exceeds the secondary threshold, the tool identifies a potential "Buy" scenario.
- Bearish Sentiment: If the primary value falls below the secondary threshold, the tool identifies a potential "Sell" scenario.
4. Real-Time Feedback In addition to drawing lines on the chart, the script provides live text updates in the corner of your screen. It automatically displays the current status—notifying you of a "Buy" or "Sell" opportunity—along with the specific price value associated with that trend.
Summary for the Trader
Essentially, this tool acts as a trend filter. It looks at how high and low the price has traveled recently, calculates where the "ceiling" and "floor" are, and then provides visual and text-based cues to help you stay on the right side of the market momentum.
//+------------------------------------------------------------------+
//|                                                 SilverTrend .mq4 |
//|                             SilverTrend  rewritten by CrazyChart |
//|                                                 http://viac.ru/  |
//+------------------------------------------------------------------+
#property copyright "SilverTrend  rewritten by CrazyChart"
#property link      "http://viac.ru/ "

#property indicator_chart_window
#property indicator_buffers 2
#property indicator_color1 DarkOrange
#property indicator_color2 Red
//---- input parameters

extern int       CountBars=300;
extern int       SSP=7;
extern double    Kmin=1.6;
extern double    Kmax=50.6; //24 21.6 21.6


//---- buffers
double ExtMapBuffer1[];
double ExtMapBuffer2[];
//+------------------------------------------------------------------+
//| Custom indicator initialization function                         |
//+------------------------------------------------------------------+
int init()
  {
//---- indicators
   IndicatorBuffers(2);
   SetIndexStyle(0,DRAW_LINE,0,1,DarkOrange);
   SetIndexBuffer(0,ExtMapBuffer1);
   SetIndexStyle(1,DRAW_LINE,0,1,Red);
   SetIndexBuffer(1,ExtMapBuffer2);


//----
   return(0);
  }
//+------------------------------------------------------------------+
//| Custor indicator deinitialization function                       |
//+------------------------------------------------------------------+
int deinit()
  {

   return(0);
  }
//+------------------------------------------------------------------+
//| Custom indicator iteration function                              |
//+------------------------------------------------------------------+
int start()
  {

  if (CountBars>=Bars) CountBars=Bars;
   SetIndexDrawBegin(0,Bars-CountBars+SSP);
   SetIndexDrawBegin(1,Bars-CountBars+SSP);
  int i, i2,loopbegin,counted_bars=IndicatorCounted();
  double SsMax, SsMin, K, val1, val2, smin, smax, price;

  if(Bars<=SSP+1) return(0);
  //---- initial zero

//K=33-RISK;

/*
if (firstTime==true)   {
   loopbegin = CountBars;
   if (loopbegin>(Bars-2*SSP+1)) loopbegin=Bars-2*SSP+1;
   firstTime=False;
}; ðóäèìåíò ñòàðîé ïðîãðàììû
*/
  if(Bars<=SSP+1) return(0);
//---- initial zero

//+++++++
if(counted_bars<SSP+1)
   {
      for(i=1;i<=SSP;i++) ExtMapBuffer1[CountBars-i]=0.0;
      for(i=1;i<=SSP;i++) ExtMapBuffer2[CountBars-i]=0.0;
   }
//+++++++-SSP


for(i=CountBars-SSP;i>=0;i--) {


  SsMax = High[Highest(NULL,0,MODE_HIGH,SSP,i-SSP+1)];
  SsMin = Low[Lowest(NULL,0,MODE_LOW,SSP,i-SSP+1)];
   smin = SsMin-(SsMax-SsMin)*Kmin/100;
   smax = SsMax-(SsMax-SsMin)*Kmax/100;
   ExtMapBuffer1[i-SSP+6]=smax;
   ExtMapBuffer2[i-SSP-1]=smax;
   val1 = ExtMapBuffer1[0];
   val2 = ExtMapBuffer2[0];
if (val1 > val2) Comment("ïîêóïêà buy ",val1);

if (val1 < val2) Comment("ïðîäàæà sell ",val2);


}


//----
   return(0);
  }
//+------------------------------------------------------------------+
Comments