Figurelli Pivot
Download script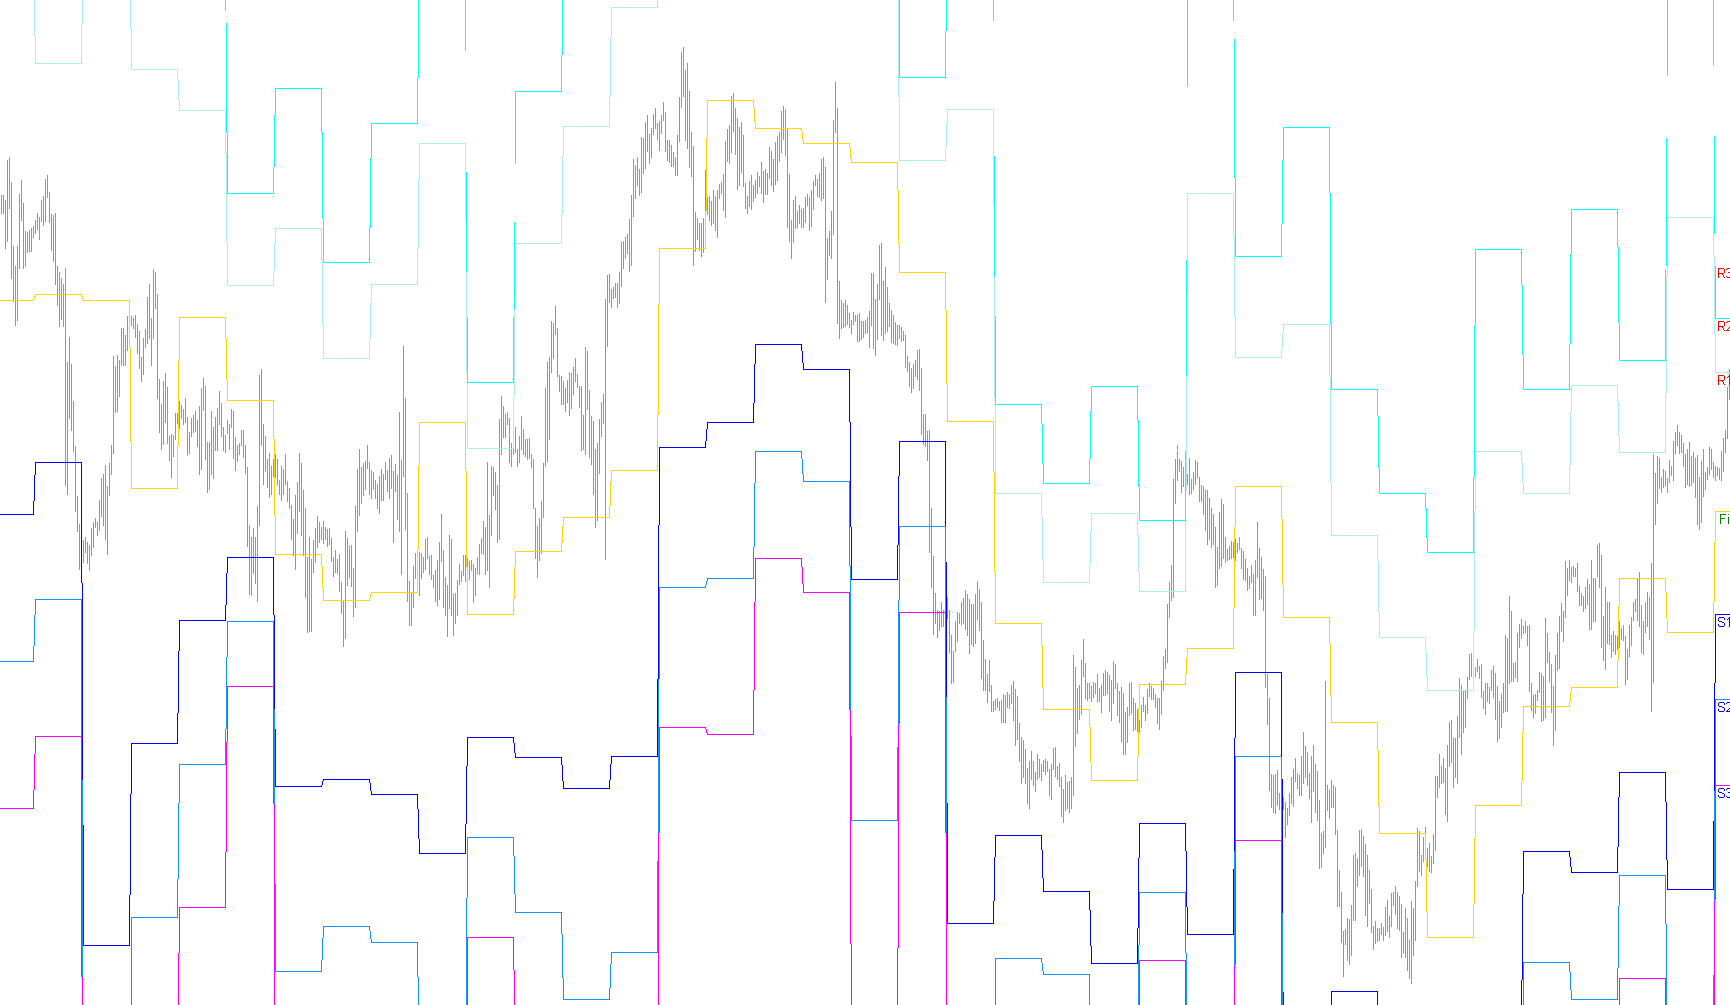
The Figurelli Pivot is a sophisticated technical analysis tool designed to identify key support and resistance levels on a trading chart. Unlike standard pivot point calculations that rely solely on fixed price averages, this indicator incorporates a dynamic logic that accounts for the "influence" of buyers (Bulls) and sellers (Bears) based on price action behavior.
Core Logic Overview
The script operates by analyzing the high, low, and closing prices of previous trading sessions to project specific levels for the current period. Its primary objective is to determine where the market equilibrium lies and where potential turning points may occur.
Key Features of the Methodology:
-
Sentiment-Based Calculations: The indicator does not use a "one size fits all" formula. Instead, it evaluates the relationship between the previous session's high and low relative to the closing price. It essentially asks whether the market closed closer to the top or the bottom of its range. This allows the tool to weight the "strength" of either the bulls or the bears when calculating the central pivot point.
-
Three Dynamic Scenarios: The logic branches into three distinct mathematical paths depending on price action:
- Bullish Influence: If the price closed significantly closer to the high of the previous period, the script calculates levels that favor upward momentum.
- Bearish Influence: If the price closed significantly closer to the low of the previous period, the script adjusts the levels to reflect downward pressure.
- Neutral Equilibrium: If the price closed in a balanced position between the high and low, the indicator defaults to a standard balanced calculation.
-
Support and Resistance Mapping: Based on the calculated central Pivot (P), the script generates three distinct levels of support (S1, S2, S3) and resistance (R1, R2, R3).
- Resistance levels act as "ceilings" where selling pressure may increase.
- Support levels act as "floors" where buying interest may emerge.
Visual and Practical Application
For the user, the script automatically draws these levels onto the chart for each new day. It creates a visual roadmap of the market's structure, allowing traders to see at a glance where price might stall or reverse. By identifying these zones, it helps in planning entries, exits, and profit targets based on the prevailing sentiment of the preceding market activity.
//+------------------------------------------------------------------+
//|                                              Figurelli Pivot.mq4 |
//|                                                Rogerio Figurelli |
//|                                      figurelli@quantafinance.com |
//+------------------------------------------------------------------+
//|                                                    QuantaFinance |
//|                                     http://www.quantafinance.com |
//+------------------------------------------------------------------+
//|                                        Figurelli Pivot Indicator |
//|              calculates pivot points using Bulls/Bears influence |
//+------------------------------------------------------------------+
#property copyright "QuantaFinance"
#property link      "http://www.quantafinance.com"

// Version 2009-09-02

#property indicator_chart_window

#property indicator_buffers 7

#property indicator_color1  Green
#property indicator_color2  Blue
#property indicator_color3  Red
#property indicator_color4  Blue
#property indicator_color5  Red
#property indicator_color6  Blue
#property indicator_color7  Red

//---- input parameters

//---- buffers
double P_buffer[];
double S1_buffer[];
double R1_buffer[];
double S2_buffer[];
double R2_buffer[];
double S3_buffer[];
double R3_buffer[];

double P,S1,R1,S2,R2,S3,R3;
double periodHigh,periodLow;

//+------------------------------------------------------------------+
//| Custor indicator deinitialization function                       |
//+------------------------------------------------------------------+
int deinit() {
   ObjectDelete("Pivot");
   ObjectDelete("Sup1");
   ObjectDelete("Res1");
   ObjectDelete("Sup2");
   ObjectDelete("Res2");
   ObjectDelete("Sup3");
   ObjectDelete("Res3");
   return(0);
}
//+------------------------------------------------------------------+
//| Custom indicator initialization function                         |
//+------------------------------------------------------------------+
int init()  {
   SetIndexStyle(0,DRAW_LINE);
   SetIndexStyle(1,DRAW_LINE);
   SetIndexStyle(2,DRAW_LINE);
   SetIndexStyle(3,DRAW_LINE);
   SetIndexStyle(4,DRAW_LINE);
   SetIndexStyle(5,DRAW_LINE);
   SetIndexStyle(6,DRAW_LINE);
   SetIndexBuffer(0,P_buffer);
   SetIndexBuffer(1,S1_buffer);
   SetIndexBuffer(2,R1_buffer);
   SetIndexBuffer(3,S2_buffer);
   SetIndexBuffer(4,R2_buffer);
   SetIndexBuffer(5,S3_buffer);
   SetIndexBuffer(6,R3_buffer);
   IndicatorShortName("Figurelli Pivot");
   SetIndexLabel(0,"Figurelli Pivot");
   SetIndexDrawBegin(0,1);
   return(0);
}
//+------------------------------------------------------------------+
//| Custom indicator iteration function                              |
//+------------------------------------------------------------------+
int start() {
   int counted_bars=IndicatorCounted();
   int limit;

   if (counted_bars==0) {
       if (Period()>240) return(-1);
       ObjectCreate("Pivot",OBJ_TEXT,0,0,0);
       ObjectSetText("Pivot","                     Figurelli Pivot",10,"Arial",Green);
       ObjectCreate("Sup1",OBJ_TEXT,0,0,0);
       ObjectSetText("Sup1","     S1",10,"Arial",Blue);
       ObjectCreate("Res1",OBJ_TEXT,0,0,0);
       ObjectSetText("Res1","     R1",10,"Arial",Red);
       ObjectCreate("Sup2",OBJ_TEXT,0,0,0);
       ObjectSetText("Sup2","     S2",10,"Arial",Blue);
       ObjectCreate("Res2",OBJ_TEXT,0,0,0);
       ObjectSetText("Res2","     R2",10,"Arial",Red);
       ObjectCreate("Sup3",OBJ_TEXT,0,0,0);
       ObjectSetText("Sup3","     S3",10,"Arial",Blue);
       ObjectCreate("Res3",OBJ_TEXT,0,0,0);
       ObjectSetText("Res3","     R3",10,"Arial",Red);
   }
   if (counted_bars<0) return(-1);
   limit=(Bars-counted_bars)-1;
   for (int i=limit;i>=0;i--) {
       if (High[i+1]>periodHigh) periodHigh=High[i+1];
       if (Low[i+1]<periodLow) periodLow=Low[i+1];
       if (TimeDay(Time[i])!=TimeDay(Time[i+1]) && TimeDayOfWeek(Time[i])>0) {
           if (i>0) {
               // ----------------------------------------------------
               // Figurelli Pivot
               // ----------------------------------------------------
               if ((periodHigh-Close[i+1])>(Close[i+1]-periodLow)) {
                  P=(2*periodHigh+Close[i+1])/3;
                  R1=(1*P)+(periodHigh-(1*periodLow));
                  S1=(3*P)-((3*periodHigh)-periodLow);
                  R2=(2*P)+(periodHigh-(2*periodLow));
                  S2=(6*P)-((6*periodHigh)-periodLow);
                  R3=(3*P)+(periodHigh-(3*periodLow));
                  S3=(9*P)-((9*periodHigh)-periodLow);
               }
               else if ((periodHigh-Close[i+1])<(Close[i+1]-periodLow)) {
                  P=(2*periodLow+Close[i+1])/3;
                  R1=(3*P)+(periodHigh-(3*periodLow));
                  S1=(1*P)-((1*periodHigh)-periodLow);
                  R2=(6*P)+(periodHigh-(6*periodLow));
                  S2=(2*P)-((2*periodHigh)-periodLow);
                  R3=(9*P)+(periodHigh-(9*periodLow));
                  S3=(3*P)-((3*periodHigh)-periodLow);
               }
               else {
                  P=(periodHigh+periodLow+Close[i+1])/3;
                  R1=P+(periodHigh-periodLow);
                  S1=P-(periodHigh-periodLow);
                  R2=(2*P)+(periodHigh-(2*periodLow));
                  S2=(2*P)-((2*periodHigh)-periodLow);
                  R3=(3*P)+(periodHigh-(3*periodLow));
                  S3=(3*P)-((3*periodHigh)-periodLow);
               }
           }
           // ----------------------------------------------------
           ObjectMove("Pivot",0,Time[i],P);
           ObjectMove("Sup1",0,Time[i],S1);
           ObjectMove("Res1",0,Time[i],R1);
           ObjectMove("Sup2",0,Time[i],S2);
           ObjectMove("Res2",0,Time[i],R2);
           ObjectMove("Sup3",0,Time[i],S3);
           ObjectMove("Res3",0,Time[i],R3);
           periodHigh=High[i];
           periodLow=Low[i];
       }
       P_buffer[i]=P;
       S1_buffer[i]=S1;
       R1_buffer[i]=R1;
       S2_buffer[i]=S2;
       R2_buffer[i]=R2;
       S3_buffer[i]=S3;
       R3_buffer[i]=R3;
   }
   return(0);
}
//+------------------------------------------------------------------+
Comments